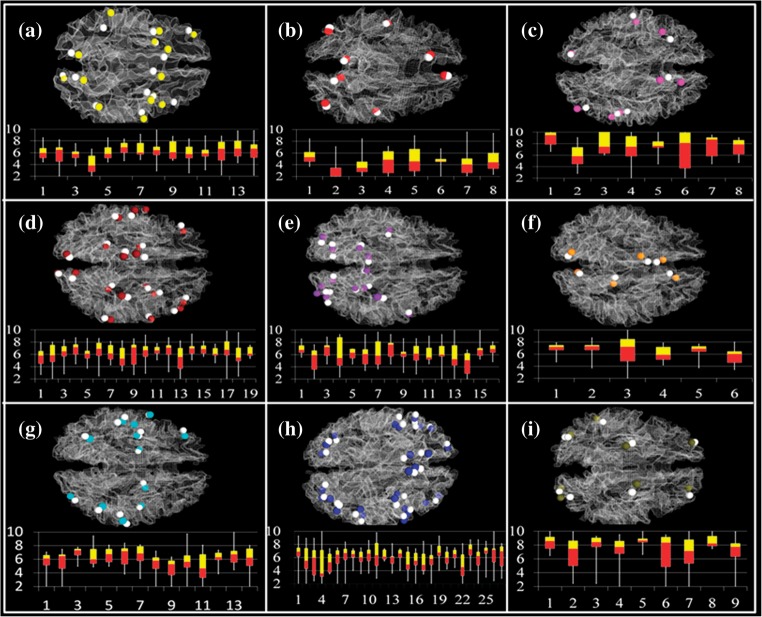
Figure 7.
Functional localizations of 95 DICCCOLs determined by 121 fMRI-derived functional regions. Specifically, 76 of them are located adjacently to one functional network, 16 of them are located within 2 functional networks, and 3 of them are located inside 3 functional networks. (a) Working memory network (data set 2). White spheres represent fMRI-derived benchmarks and yellow spheres represent corresponding DICCCOLs. The distances between centers of fMRI benchmarks and DICCCOLs are shown in the bottom panel, in which the horizontal axis indexes activations and the vertical axis is the distance in the unit of millimeter. Each bar represents the median (interface between the red and yellow bars), minimum and maximum value (2 ends of the white line), 25% (bottom of the red bar), and 75% (top of the yellow bar) of the distances for each fMRI activation peak. The average distance is 6.07 mm (b–i) results for default mode (data set 1), auditory (data set 4), semantic decision making (data set 1), emotion (data set 1), empathy (data set 1), fear (data set 1), attention (data set 3), visual networks (data set 4), respectively. In b–i, white spheres stand for fMRI benchmarks and other colors represent corresponding DICCCOLs. The average distances between centers of fMRI benchmarks and DICCCOLs in these networks are 5.50, 6.48, 6.25, 6.12, 6.41, 5.93, 5.94, and 7.59 mm, respectively.

