
Figure 2.
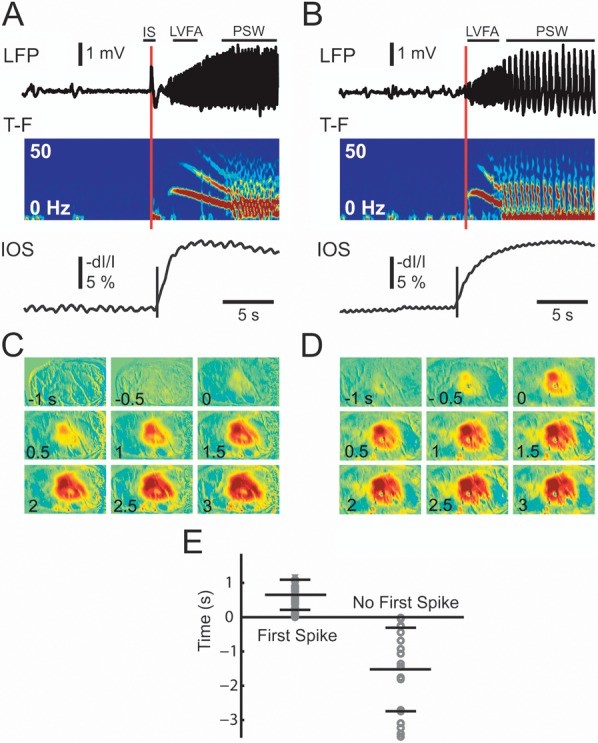
The initiation of the seizure and the IOS. (A) Seizures that began with an initial spike (IS) followed by LVFA and (B) seizures that began without an IS. Both seizure types then evolve in PSW activity . The top trace shows the LFP recording, the next time–frequency (T–F) tracing shows the instant frequency distribution of the LFP calculated with a 512 ms sliding window. Note the onset and evolution of the seizure from LVFA to PSW activity. The IOS (bottom tracing) tracing is a graph of the IOS recorded from a ROI in the same location as the LFP electrode. The red vertical line indicates the onset time of the seizure base on 2 SD increase of activity. The black vertical line in the IOS tracing indicates the onset time of the IOS signal using a similar 2 SD threshold. (C) and (D) The spatiotemporal evolution and timing of the IOS for each of the 2 types of ictal event shown in (A) and (B). Note, the IOS is apparent in the first frame of (D) just before the onset of the seizure. (E) The distribution of the delay of IOS onset for the entire data set. Each circle represents the onset of the first statistical change in the IOS with respect to the onset of the ictal event from the LFP recording for seizures that began with a first spike (left) and those that begin without a first spike (right). A positive number indicates IOS onset is later than LFP onset and a negative number indicates IOS onset is earlier than the LFP onset. The long horizontal bar indicated the mean delay and the short horizontal bar indicated the SD of the distribution of the onset times.