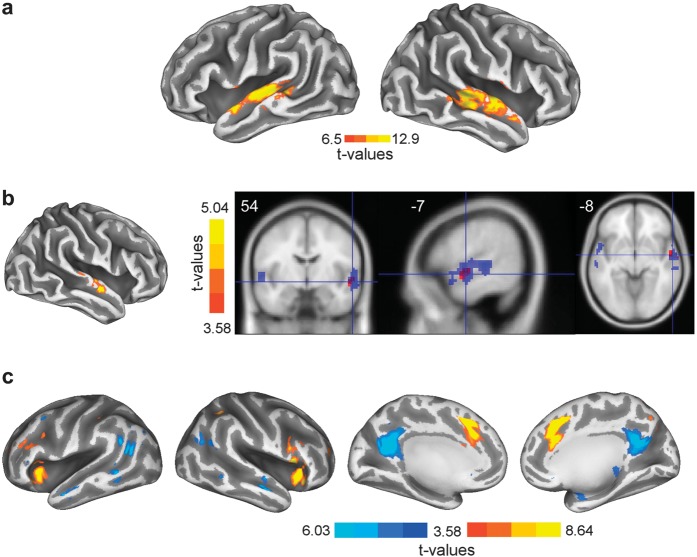
Figure 2.
(a) Inflated cortical surface depicting the TVAs in both hemispheres. Throughout Figure 2, the color bar depicts the statistical lower boundary and global maxima. (b) Left: inflated cortical surface showing the activation map obtained with the physical difference regressor. Right: axial, sagittal, and coronal slices showing the TVAs (in blue) and the effect of physical difference (in red). Note how the effect of physical difference overlaps with the anterior parts of the TVAs. (c) Inflated cortical surfaces showing the activation maps for the perceptual difference regressor. On the 2 inflated cortical surfaces on the left, are shown the activity maps in the bilateral inferior frontal gyrus/insulae (positive; color map red-to-yellow) and middle temporal gyrus (negative; color map dark-to-light blue). On the 2 right most inflated cortical surfaces is depicted the bilateral activity maps for the anterior cingulate gyrus (positive; color map red-to-yellow) and precuneus (negative; color map dark blue-to-light blue).

