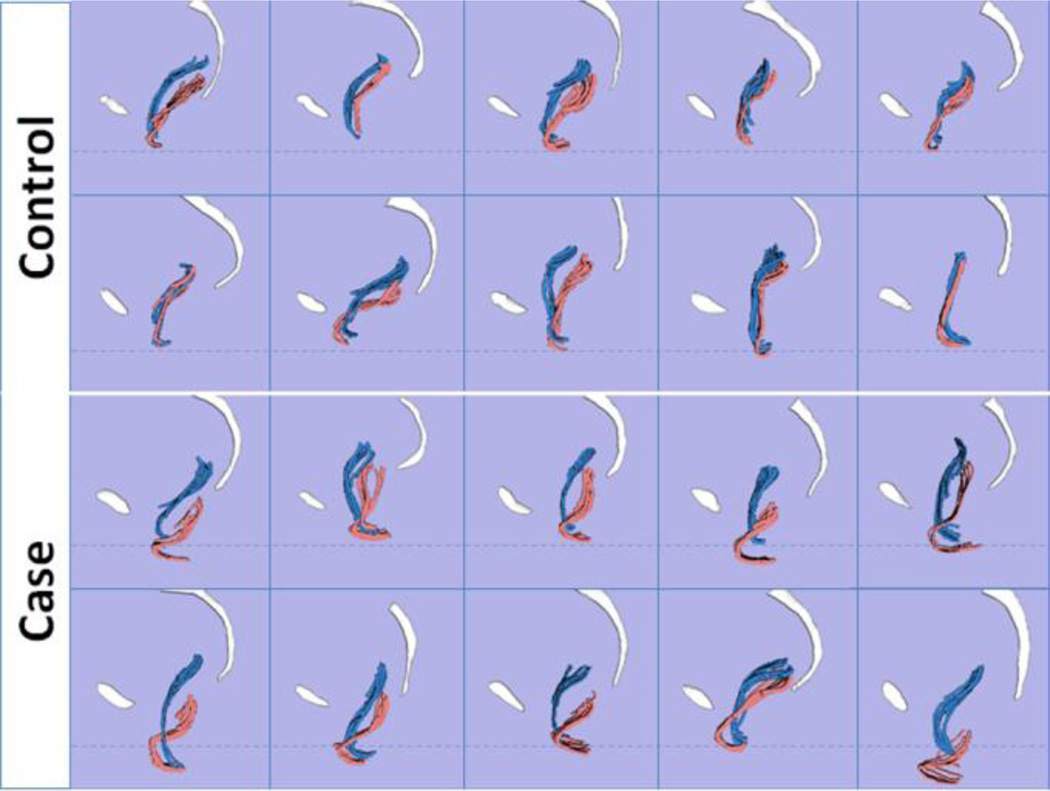
Fig 2. 3D case and control models comparison.
Lateral view of posterior vaginal walls of 10 controls and 10 cases during rest (blue) and Valsalva (pink). The vaginal wall was modeled using sagittal strips to avoid artifacts from smoothing. Pubis and sacrum are shown in white. Dotted lines indicate the average level of the perineal body for visual reference. (© DeLancey 2011)

