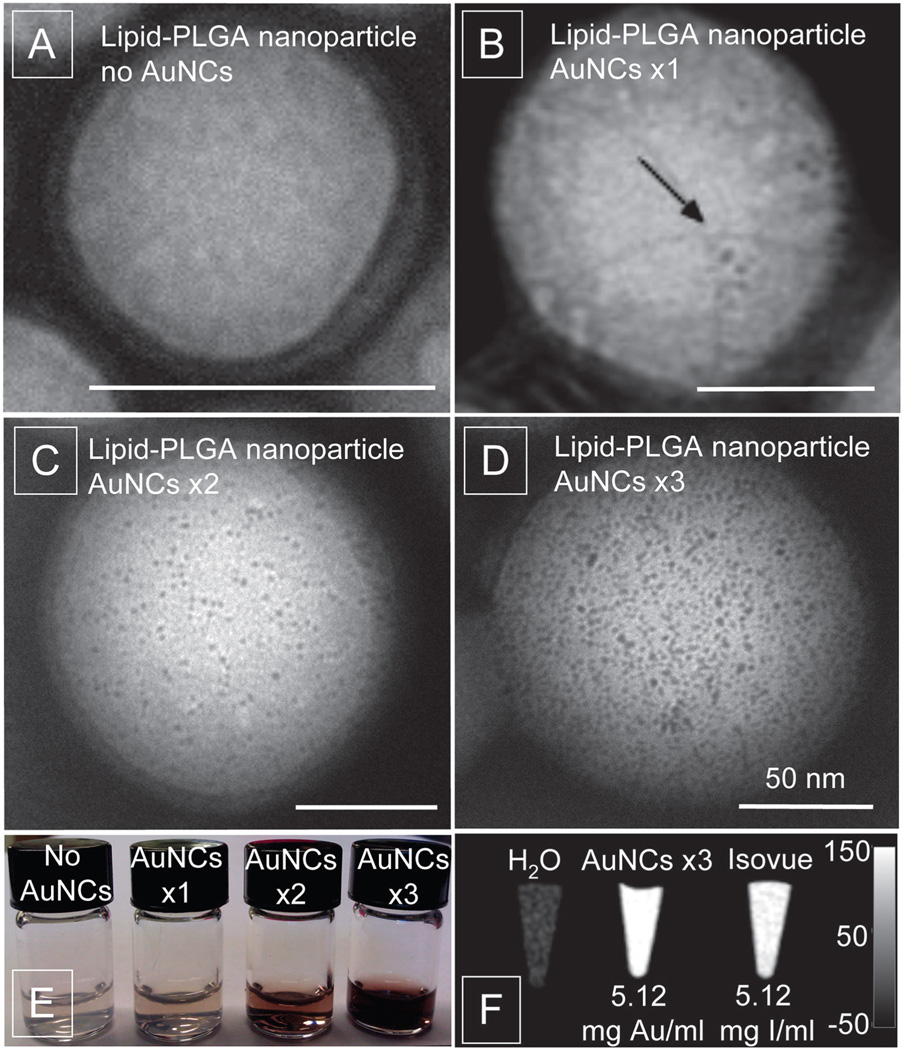
Fig. 1.
TEM images of lipid-PLGA nanoparticles only (A), and with AuNCs ×1 (B), AuNCs ×2 (C), and AuNCs ×3 (D); all scale bars are 50 nm. (E) Lipid-PLGA nanoparticles with increasing amounts of AuNCs. (F) CT contrast obtained from lipid-PLGA nanoparticles with AuNCs compared to Isovue and water at 140 kV and 250 mA (scale in Hounsfield units).

