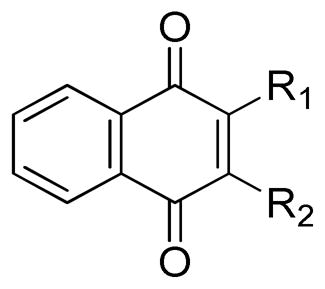
TABLE 1.
In Vitro Neuroprotective Activity of 1,4-naphthoquinones substituted at the 2′ and 3′ positions.

| |||||
|---|---|---|---|---|---|
| Compound | R1 | R2 | Protectiona | Toxicityb | Safety Index |
|
| |||||
| PC50 (nM) | TC50 (nM) | TC50/PC50 | |||
| VK2 | - | - | 432 | >100,000 | 231 |
|
| |||||
| 1a | -H | -H | 1541 | 19,000 | 12 |
| 1b | -Me | -H | 797 | 19,000 | 24 |
| 1c | -Me | -Me | 118 | 30,000 | 254 |
| 1d | -NH2 | -H | 61 | 49,000 | 803 |
| 1e | -NH2 | -Me | 1740 | 54,000 | 31 |
| 1f | -COOH | -H | 716 | >100,000 | 140 |
| 1g | -OH | -H | 1005 | >100,000 | 100 |
In vitro neuroprotective activity and
neurotoxicity assessed by treating HT22 cells with various concentrations of compounds with or without 10 mM glutamate for 24 hrs. Cell viability was estimated by treating cells with MTS and measuring absorbance at 490 nM. PC50, concentration producing 50% protection, values calculated using GraphPad Prism based on 12 point titrations, n ≥ 4; TC50, concentration producing 50% toxicity, values calculated using GraphPad Prism based on 7 point titrations, n ≥ 3.
