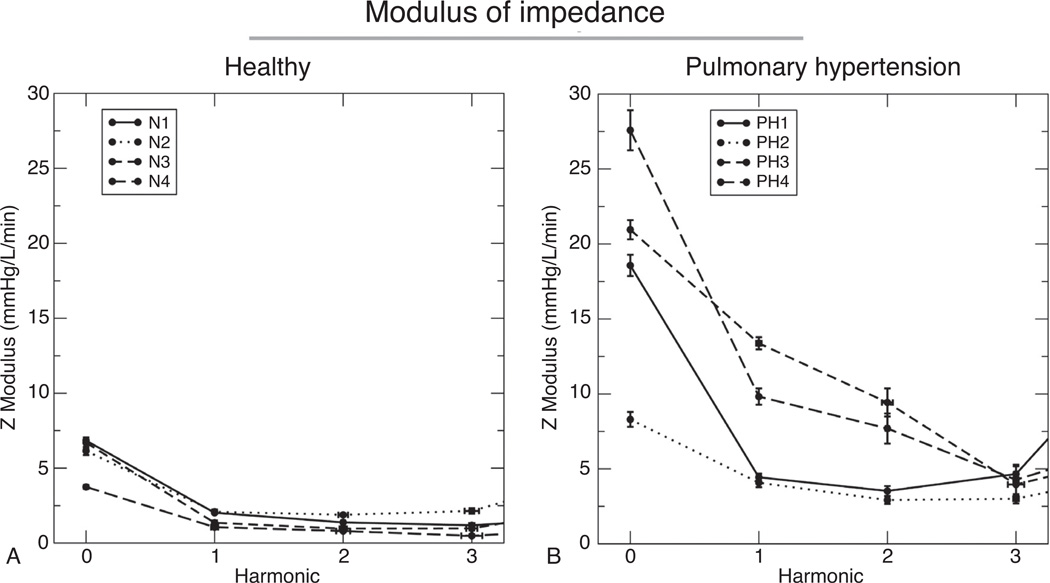
Figure 3.
Impedance modulus in healthy (A) and pulmonary hypertensive (B) children. As with other clinical studies of impedance, pulmonary hypertensive individuals displayed both larger values of Z0, corresponding to higher PVR and larger values of the first several harmonics of impedance. Further, the first minimum of the curve is shifted rightward in the PH patients, corresponding to higher pulse-wave velocities (56).

