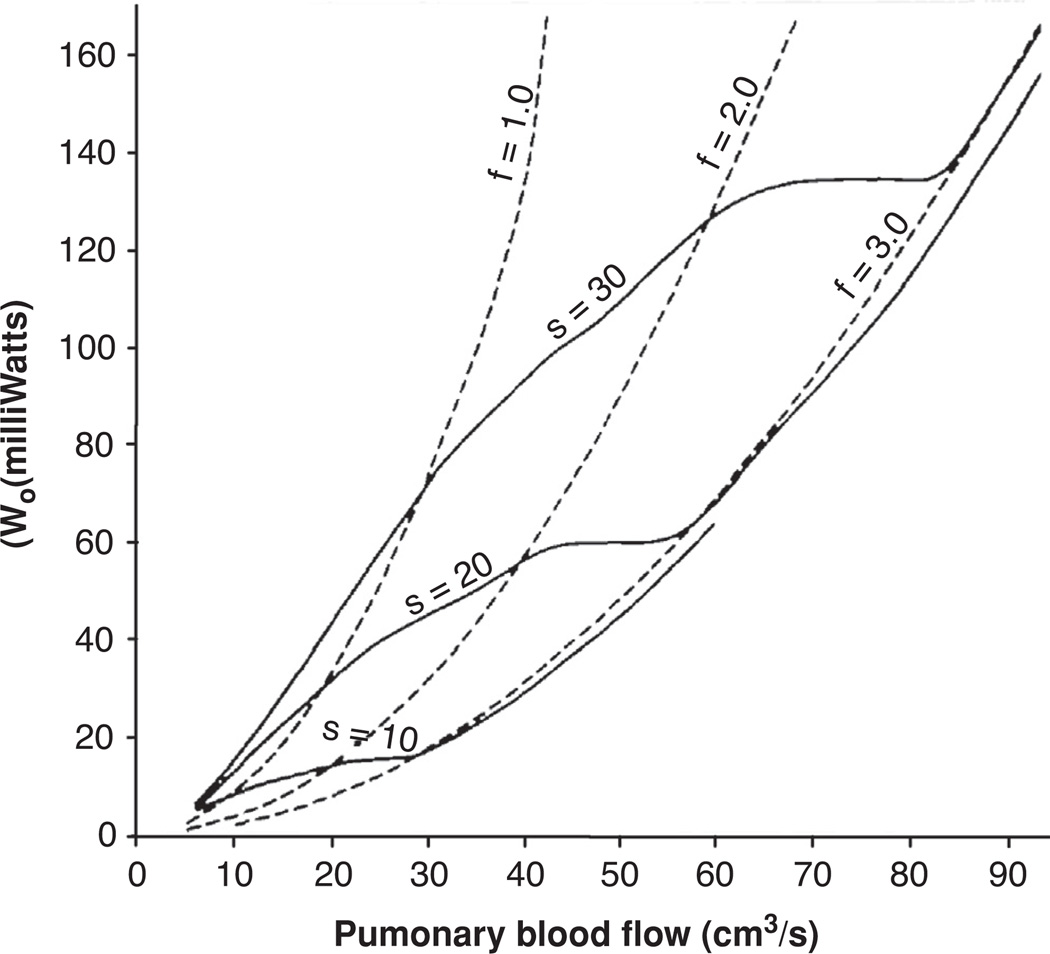
Figure 8.
Oscillatory component of input power (ordinate) at different levels of pulmonary blood flow (abscissa) for three different heart rates at constant stroke volume (solid line) and for three different stroke volumes at constant heart rate (solid line). Constant stroke volume curves are shown for three volumes (S = 10, 20, and 30 cm3/stroke) and constant heart rate curves are shown for three rates (f = 1.0, 2.0, and 3.0 beats/s). Constant stroke volume and constant heart rate curves are nearly equal for heart rates above 3 beats/s. Plot shows that pulmonary blood flow can be increased more efficiently by increasing heart rate than by increasing stroke volume (87).

