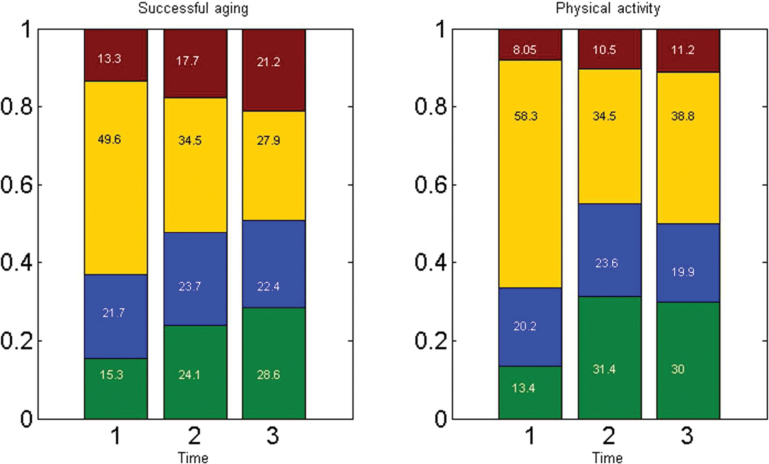
Figure 2.
State prevalence across time stratified by randomization arm. Legend: Green = state 1 = good physical functioning; Blue = state 2 = mild deficits in physical functioning; Yellow = state 3 = moderate deficits in physical functioning; Red = state 4 = severe deficits in physical functioning; Time 1 = baseline; Time 2 = 6 mo; Time 3 = 12 mo; Numbers within bars indicate percentage of total population in that states at that time.

