
Fig. 2.
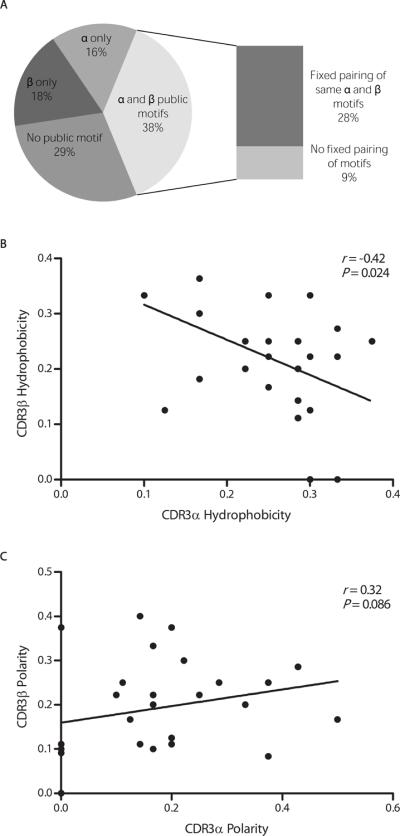
Relationships between paired CDR3α and CDR3β sequences in CMV-NLV-specific CD8 T-cell repertoire. (A) Prevalence of CDR3α and CDR3β public motif usage among all responses. Percentages were derived from paired CDR3αβ data (N = 135 TCR sequences). (B) and (C) Relationships between hydrophobicity (B) or polarity (C) values within paired CDR3α and CDR3β amino acid sequences. Hydrophobicity and polarity are defined in the text. In (B) and (C), each symbol represents one CDR3αβ pair. Correlation was assessed using the Spearman's rank correlation coefficient. Percentages do not total 100% due to rounding error.