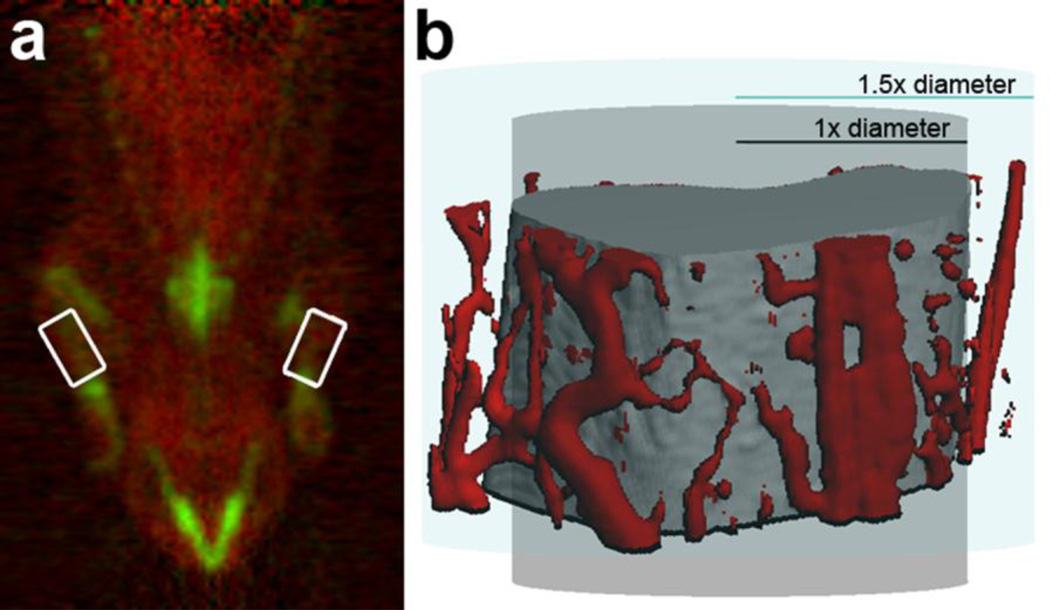
FIGURE 1.
a) The 15O water PET scan (red) has been superimposed on the 18F fluoride scan (green). The areas where ROIs were drawn are highlighted with white boxes. b) Using CT angiography, vessels surrounding the bone in the region of interest have been colored red. Since an ROI of the diameter of the ulna may fail to include some vessels, an ROI 1.5 times the diameter of the ulna was used for this experiment.

