
Figure 1.1.
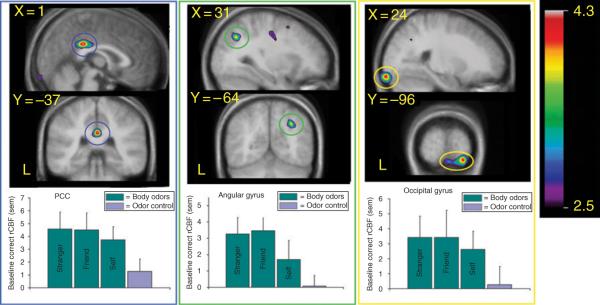
Statistical parametric maps (t statistics as represented by the color scale) of group averaged rCBF responses to processing of body odors superimposed on group averaged anatomical MRI. Blue circles mark increased rCBF in the posterior cingulate cortex (PCC), green circles mark increased rCBF response in the left angular gyrus, and yellow circles mark an increased rCBF response in the right occipital cortex. Coordinates denote center of activation and slice expressed according to the MNI world coordinates system. Left in upper row of pictures represents posterior and left in middle figures represents left side (L). Graphs under each statistical parametric map represent extracted baseline-corrected rCBF values within the activation peak, in each odor category. Error bars represent standard error of the mean (SEM). Reproduced with permission from Oxford University Press.