
Figure 1.2.
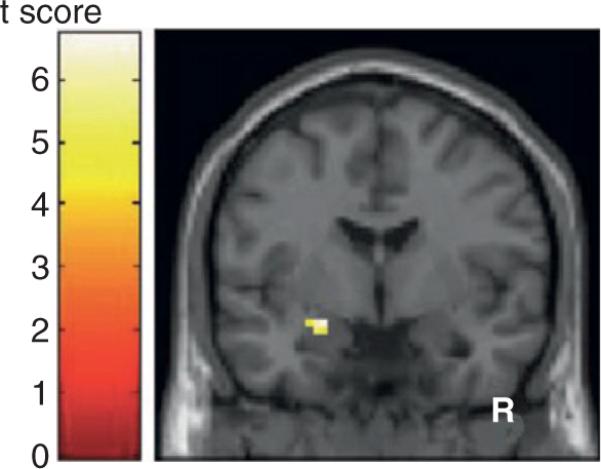
Statistical parametric maps (t statistics as represented by the color scale) of group averaged BOLD responses to the processing of fear-related body odors. Note the significant activation in the left amygdala. Reproduced with permission from the authors.