
Figure 1.3.
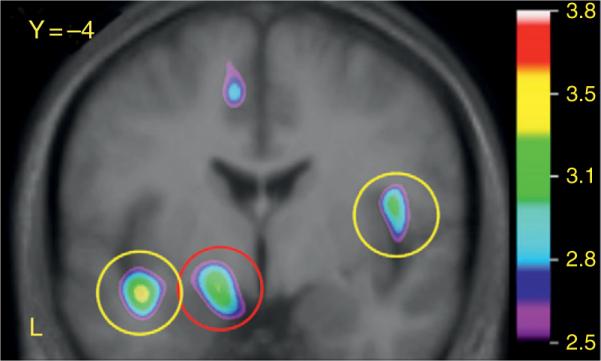
Group averaged rCBF response showed in statistical parametric map (t statistics as represented by the color scale) to the processing of the body odor of a stranger. Yellow circles mark bilateral increased rCBF in the insular cortex and red circles mark increased rCBF response in the amygdala. Left in figure represents left side (L). Reproduced with permission from Oxford University Press.