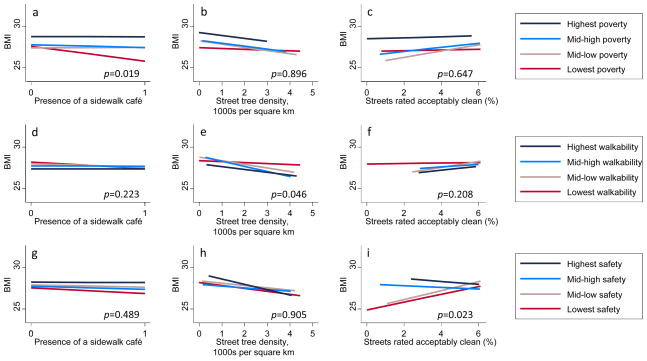
Figure 1.
Effect modification for the associations with BMI
Note: These fitted regression lines from stratified models are adjusted for individual race/ethnicity, gender, age, education as well as percentage poverty, percentage black, percentage Latino, and built-environment characteristics of the 1-kilometer network buffer (walkability index, potentially attractive features, and safety-hazard indicators); interaction p-values are from a joint significance test of interaction terms in an unstratified model.

