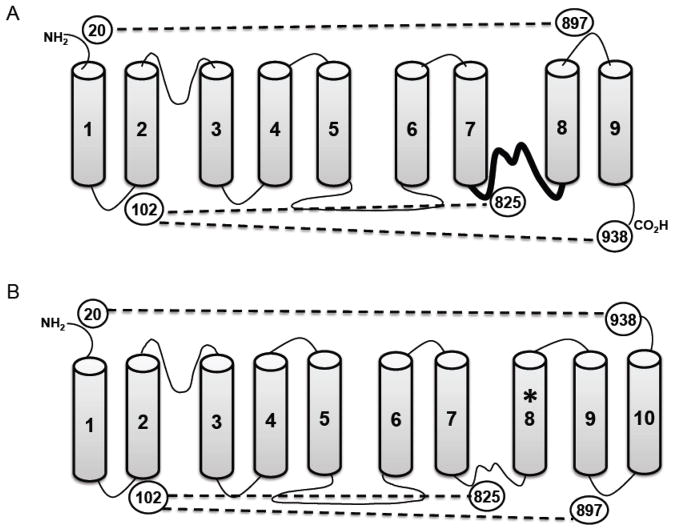
Fig. 1.
Schematics of the alternative topologies of NCX1. Panel A shows the currently accepted 9 TMS arrangement of NCX1, and panel B shows the 10 TMS topology as predicted by the crystal structure of the archaebacterial NCX_Mj. Circled numbers indicate locations of cysteines used in this study. Dotted lines indicate the predicted crosslinks with each model. The heavy line between TMSs 7 and 8 in panel A is the region that becomes the new TMS8 in panel B (designated with an asterisk). Note that TMSs 8 and 9 in the nine TMS model reverse orientation and become TMSs 9 and 10 in the ten TMS model.

