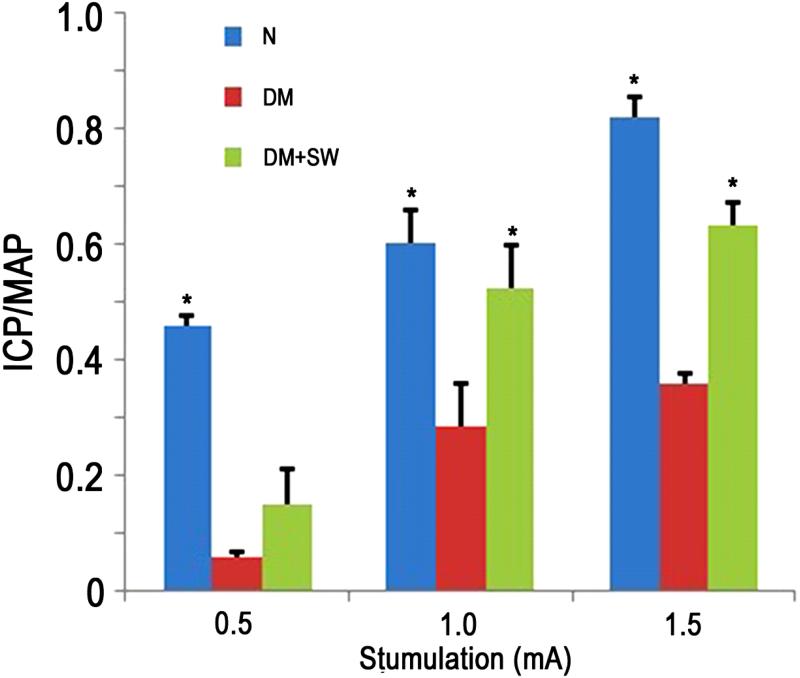
Figure 2. Evaluation of erectile function.
Rats in N group (n=8) were normal control. Rats in DM group (n=8) were diabetic. Rats in DM+SW group (n=8) were diabetic and treated with shockwaves. Their erectile function was evaluated as response in ICP to electrostimulation of cavernous nerves at three different amperages (0.5, 1.0, and 1.5). ICP was normalized with MAP. * denotes p<0.05 when compared to the DM group.

