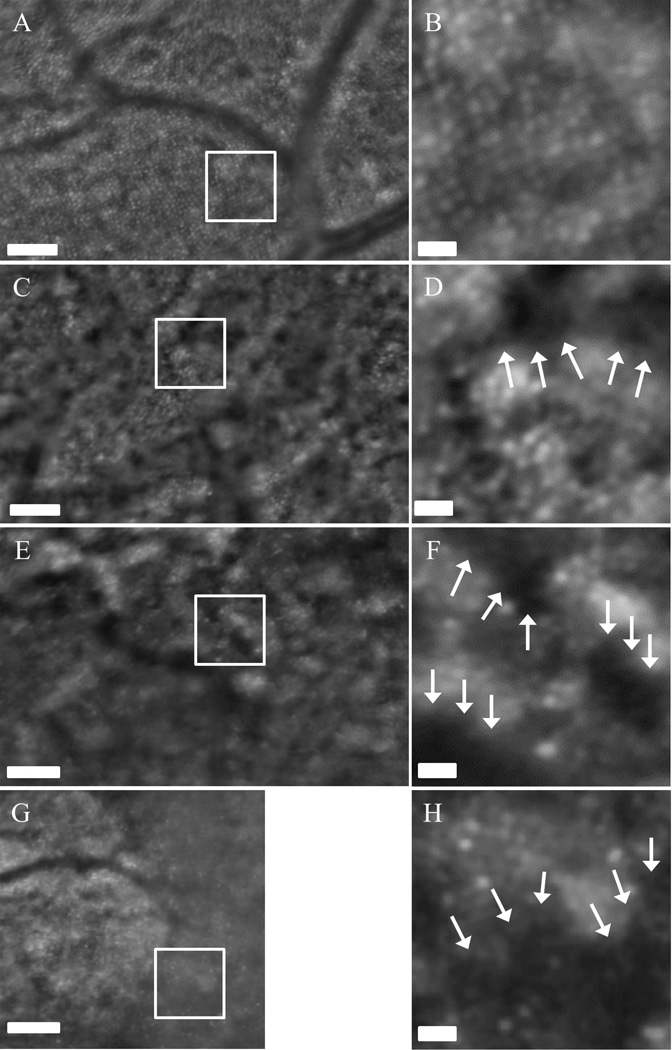
Figure 5.
AO-SLO composite images from Category I patient (A, B), Category II (C, D), Category III (E, F) and Category IV (G, H). White boxes represent the 0.5°×0.5° regions shown in B, D, F & H. An increase in photoreceptor disruption can be observed as a function of disease progression. The arrows denote regions with decreased reflectance possibly indicating loss of functionality or atrophy of cone photoreceptors. Scale bars (A, C, E, & G) = 0.1 mm. Scale bars (B, D, F, & H) = 0.02 mm

