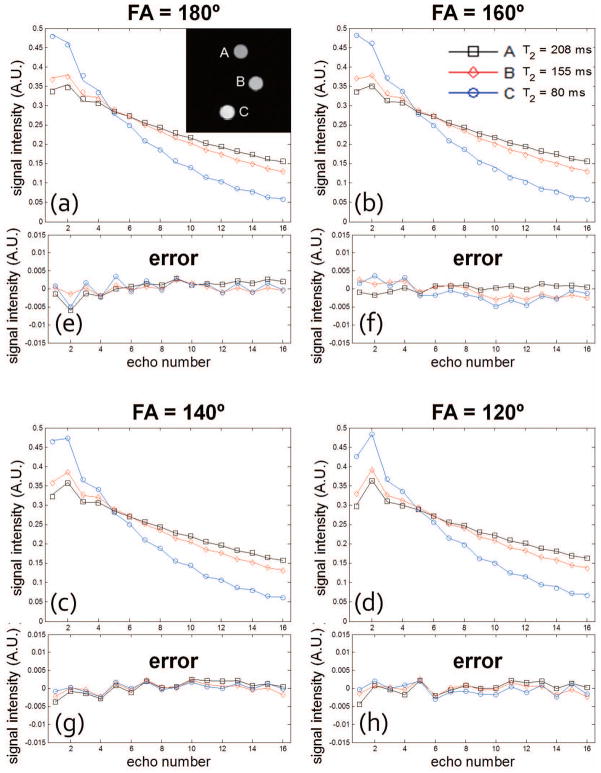
Figure 3.
(a–d) Decay curves for each of the three tubes in the phantom for different refocusing FA obtained from a standard sampled radial MESE data set (i.e. 256 radial views with 256 points per view). Data were acquired with echo spacing of 12.11 ms to mimic the TE coverage in vivo. Each point in the decay curves corresponds to the averaged signal from voxels within an ROI for each tube; each curve is the fitted curve according to the SEPG model. The curves are normalized (2-norm=1). (e–h) The approximation error when 6 PCs are used to represent the decay curves. Note that the errors are all below 0.01 (with most under 0.005) for all FAs which show that 6 PCs can represent the decay curves of the acquired data well.

