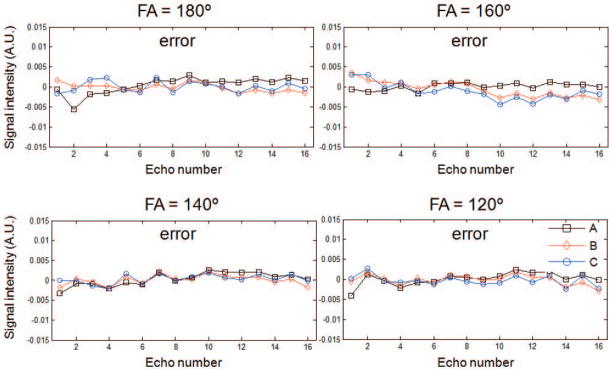
Figure 4.

The errors of the decay curves of the three-tube phantom shown in Figure 3 reconstructed from highly undersampled radial MESE data (4% sampled relative to the Nyquist condition) by using the CURLIE algorithm. Data were acquired with echo spacing of 12.11 ms to mimic the TE coverage in vivo. Note that the differences between the curves are small (the 2-norms of the differences are between 0.0035 and 0.0095) which demonstrates that decay curves from highly undersampled data can be accurately reconstructed with the CURLIE algorithm.
