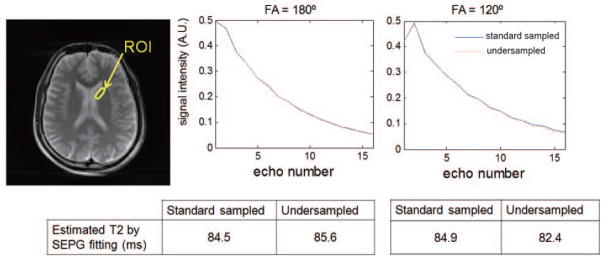
Figure 5.

Decay curves of the ROI obtained from standard sampled and 8 times less sampled radial MESE data acquired with FAs of the refocusing pulses prescribed to 180° and 120°. The T2 values for standard sampled data were obtained directly from the reconstructed TE images using SEPG fitting. The T2 values for undersampled data were obtained using CURLIE followed by SEPG fitting. T1= +∞ was used for the SEPG fitting. Data were acquired with echo spacing = 12.93 ms. Note that the curves generated from undersampled data via CURLIE are similar to the standard sampled curves (obtained directly from the acquired data). The differences between the T2 values obtained from under- and standard sampled data are below 3%. Also, the T2 values estimated from data acquired with 180° and 120° FAs are similar.
