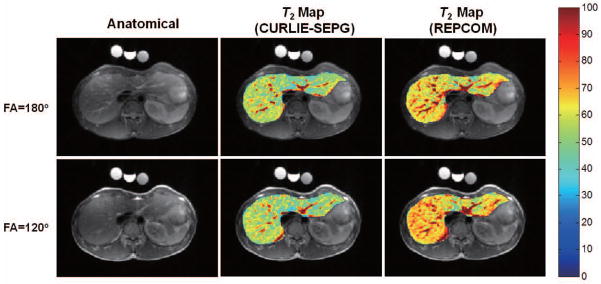
Figure 7.

(left) Anatomical abdominal images reconstructed from the same data used for T2 map generation. (middle) Liver T2 maps (overlaid onto the anatomical image) obtained by CURLIE and SEPG fitting (T1 = 500 ms) from undersampled data acquired with two refocusing pulses (FA=180° and 120°). (right) The T2 maps reconstructed by REPCOM (which ignores indirect echoes) using the same undersampled data sets as in the CURLIE reconstruction. Note that the T2 estimates obtained from the REPCOM reconstruction increase when the FA decreases from 180° to 120°, while the T2 maps reconstructed by CURLIE with SEPG fitting are comparable for the two different FAs.
