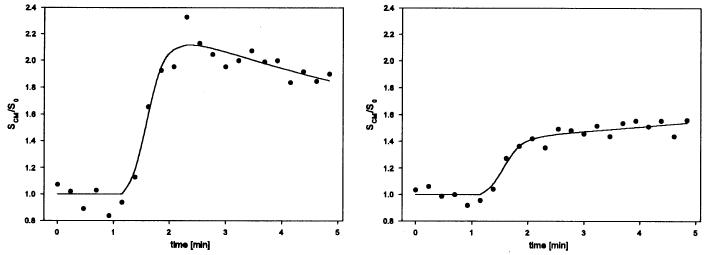
Figure 6.
Relative intensity–time curves from different tissues. Left: a voxel with meningioma tissue. The shape of the curve is typical of a tumor with strong and fast signal enhancement and moderate wash-out phase. Right: a voxel of ocular muscle. The curve shows low contrast medium accumulation and no wash-out phase. With permission from Neff T, et al. Phys Med Biol 50 (2005) 4209-4223.

