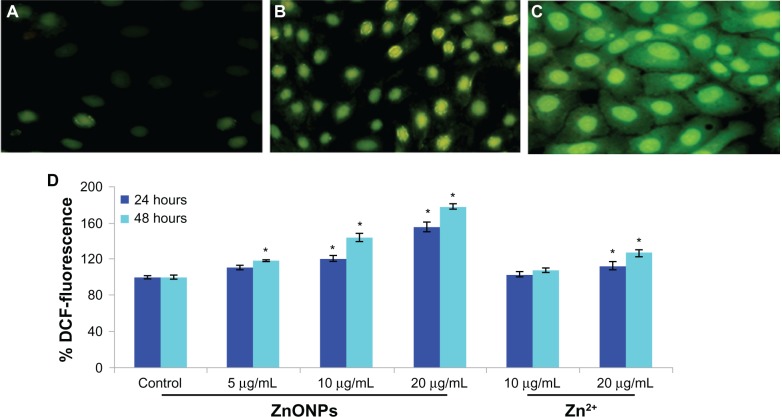
Figure 4.
Representative microphotographs showing ZnONPs and Zn2+ induced ROS generation in A375 cells. Images were captured on fluorescence microscope Nikon Eclipse 80i equipped with a Nikon DS-Ri1 12.7 mega pixel camera. (A) Control, (B) at 10 μg/mL of Zn2+, (C) at 10 μg/mL of ZnONPs. (D) Percentage change in ROS generation for 24 and 48 hours exposure to various concentrations of ZnONPs and Zn2+ in A375 cells.
Notes: Each value represents the mean ± SE of three experiments, performed in duplicate. *P < 0.01 vs control.
Abbreviation: ZnOPs, zinc oxide nanoparticles.

