
Fig. 7.
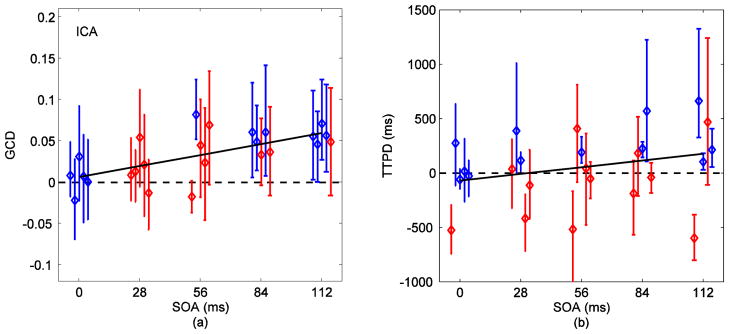
(a) GCD (Fx→y − Fy→x) versus SOA for voxels selected via ICA. The color code represents results from 95% time series block bootstrap confidence intervals on each measure (same as in Fig. 6). GCD was approximately zero at zero SOA and increased linearly with SOA as indicated by the linear mixed-effects model (dark line, p<0.0006). Loss of sensitivity of Granger causality in detecting timing differences in signals chosen from ICA (when compared to those from SOM in Fig. 6) was evident. Difference down to 84 ms was completely detected in three out of five (60%) subjects. Four subjects resulted in positive (greater than zero) GCDs for differences down to 28 ms. (b) TTPD from inverse logit (IL) fits on signals obtained via ICA. The linear relationship of TTPD with SOA (dark line) was stronger for ICA (p=0.08) than for SOM.