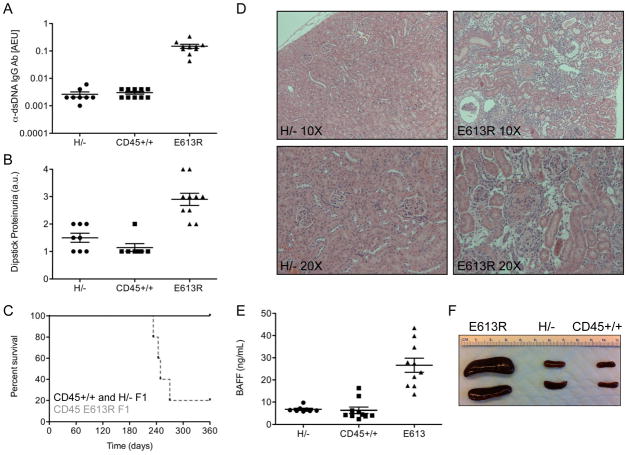
Figure 5. E613R but not H/− mice develop autoimmunity on a susceptible genetic background.
(A) Graph representing anti-dsDNA IgG antibodies assessed by ELISA in serum of 6 month old H/−, CD45+/+, and E613R B6/129 F1 mice. AEU = arbitrary elisa units. Values are mean ± SEM of 8–10 mice.
(B) Graph representing urine protein assessed by dipstick in 6 month old H/−, CD45+/+, and E613R B6/129 F1 mice. Values are mean ± SEM of 8–10 mice.
(C) Kaplan-Meier curve depicts survival of a cohort of H/−, CD45+/+, and E613R B6/129 F1 mice, N=10 per genotype.
(D) Hematoxylin and eosin staining of formalin fixed kidney sections from H/− and E613R B6/129 F1 mice at 8 months of age. Representative specimens at 10X and 20X magnification are depicted.
(E) Graph representing serum BAFF (ng/ml) assessed by ELISA in 6 month old H/−, CD45+/+, and E613R B6/129 F1 mice. Values are mean ± SEM of 8–10 mice.
(F) Representative spleens from 8 month old H/−, CD45+/+, and E613R B6/129 F1 mice.

