
Figure 3.
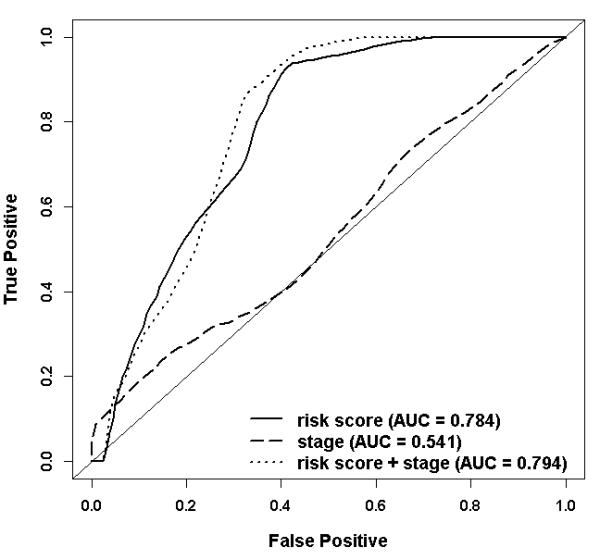
ROC curves comparing the ability to predict two years oral cavity cancer-specific survival of the three prediction models adjusted for age, gender, and treatment in the 71 oral cavity cancer patients from the MDACC dataset. The jackknife p-value testing the AUCs between the model containing term for “risk score” and the model containing term for “stage” is <0.001; the p-value comparing the models containing terms for both “risk score and stage” and the model containing the term “stage” is <0.001.