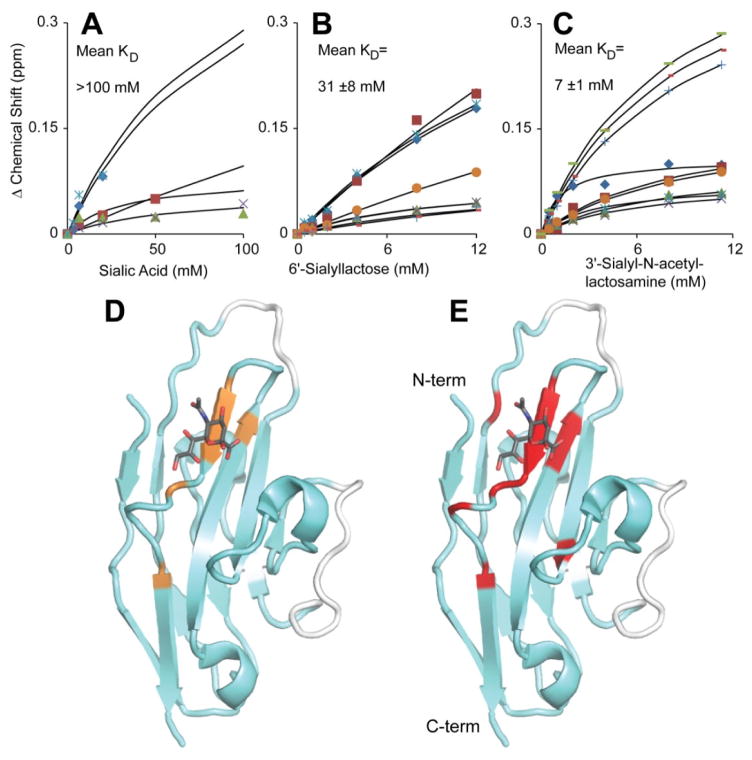
Figure 6.
NMR titrations showed the Siglec5 CRD binds free sialic acid (A), 6&-sialyllactose (B) and 3′-sialyl-N-acetyllactosamine (C). Binding curves were fit to each individual data series and then averaged to determine the mean KD ± standard deviation. The curves fit in (A) were generated using known end point values for the affected resonances based upon the fits in (B and C). (D) The sialic acid – Siglec5 interface shown in orange was determined by mapping the resonances shifted in (A) to the Siglec5 structure. The binding interfaces determined from (B) and (C) were indistinguishable and are shown as red residues plotted on the model in (E). A stick model of sialic acid is included (pdb 2zg1). Assigned resonances are shown with a cyan ribbon, unassigned with white.

