Fig. 1.
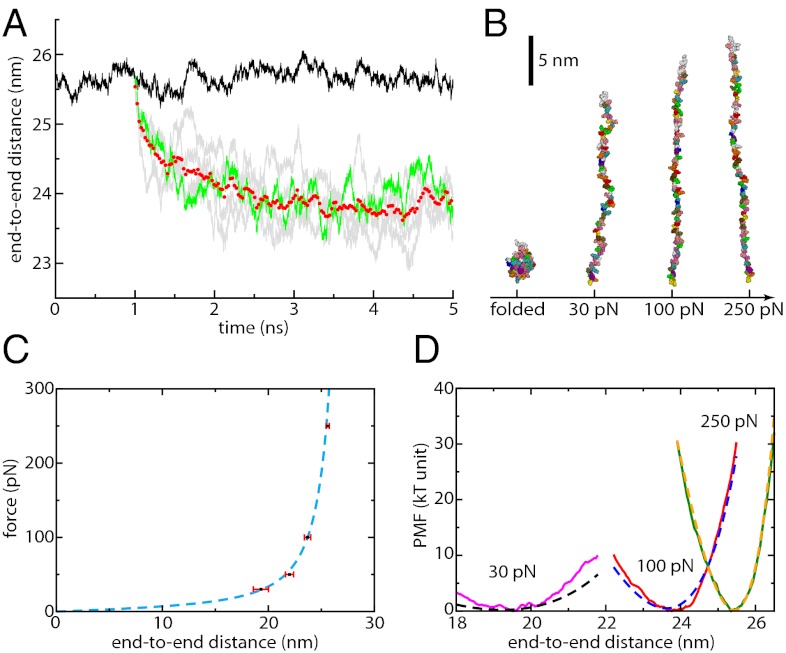
(A) End-to-end distance as a function of time for ubiquitin under an applied force of 250 pN (black curve). Relaxation trajectories are obtained by quenching force from 250 to 100 pN (gray curves, one highlighted in green) and averaged over five such trajectories (red circles). Equilibrium data are then accumulated once the average end-to-end distance has reached a plateau. A similar procedure is applied at other forces. (B) Snapshots of ubiquitin in a folded configuration (Left) and at different forces (30, 100, and 250 pN). Solvent molecules are not represented. (C) Force-extension profile at each force (black squares, average; red bars, standard deviation) and the corresponding WLC fit (dashed blue line). (D) PMF as a function of end-to-end distance at different forces (30 pN, magenta curve; 100 pN, red curve; 250 pN, green curve) and comparison with the WLC predictions (30 pN, dashed black curve; 100 pN, dashed blue curve; 250 pN, dashed yellow curve).

