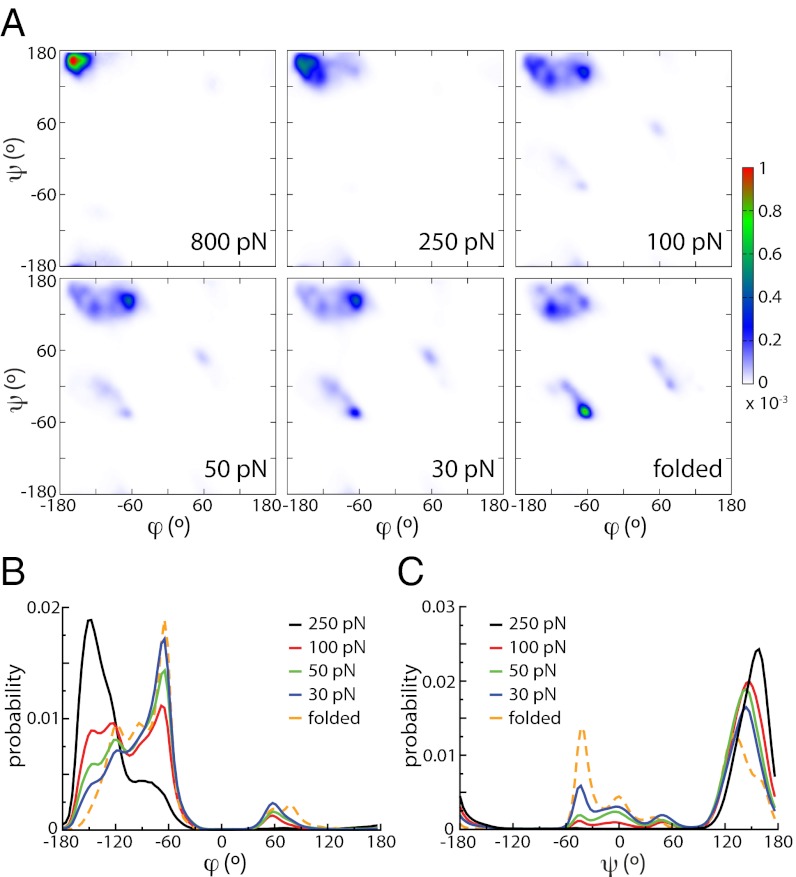
Fig. 2.
(A) Ramachandran plots of ubiquitin (Upper, from Left to Right: 800 pN, 250 pN, 100 N; Lower, from Left to Right: 50 pN, 30 pN, and folded at no force). (B) Distribution of the ϕ dihedral angle for unfolded ubiquitin at different forces and compared with the distribution for the folded, equilibrium protein at no force. (C) Same plot for the ψ dihedral angle.

