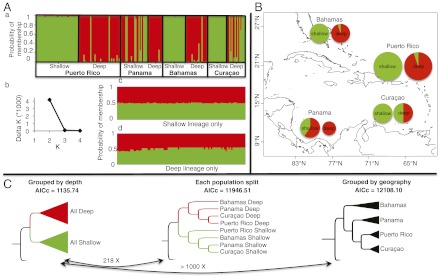
Fig. 2.

(A) Graphical summary of Bayesian clustering (a) STRUCTURE results for all samples combined. (b) Likelihood score differences (ΔK) as a function of K (number of clusters), with highest difference between K = 2 and K = 3. Separate runs for the (c) Shallow and (d) Deep lineages revealed in a show no further subdivision. (B) Proportion of individuals from shallow and deep habitats falling into the Shallow (green) and Deep (red) clusters revealed by STRUCTURE. Two individuals with ancestry probability <70% were excluded. The size of the circle is proportional to the number of sampled individuals. (C) STEM results for each of three data arrangements: by depth, by depth and geography, or by geography. Corrected Akaike information criteria scores are indicated. The black arrows denote the evidence ratios between alternative topologies from information theory.
