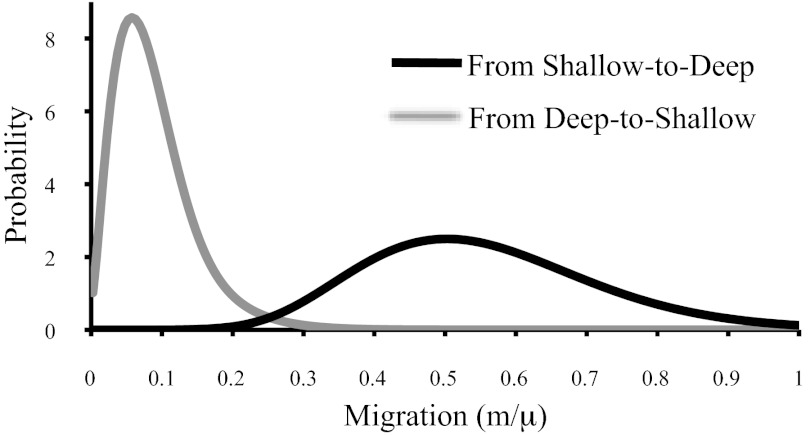
Fig. 3.
Migration rate estimates between Shallow and Deep obtained by fitting the IMa model to all four loci. Estimates are scaled by the neutral mutation rate. Samples were partitioned by morphology (excluding Panama). The number of migrants between lineages per generation (Nm) is 0.4 [90% highest posterior density (HPD) interval, 0.147–0.756] from Shallow to Deep and 0.078 (90% HPD interval, 0.02–0.189) for Deep to Shallow.

