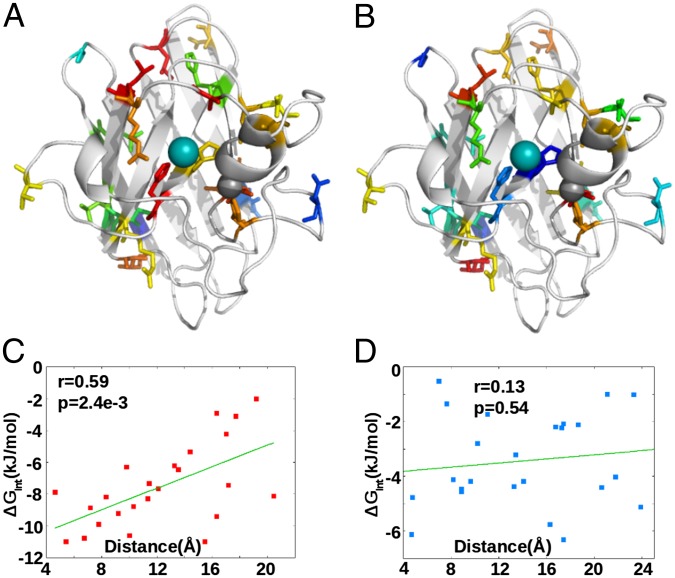
Fig. 5.
(A) Residues color-coded by interaction energy with the Cu ion (depicted as a cyan sphere). The extent of interaction is strongest in magnitude for red colored residues and decreases to blue. (B) Same as A for the Zn ion (depicted as a gray sphere). (C) Interaction energy with Cu correlates with the distance of the residue from the Cu ion; residues in close proximity more strongly interact. (D) Interaction energy with Zn does not correlate with distance of the residue to the Zn ion, indicating nonlocal allosteric effects.

