Fig. 1.
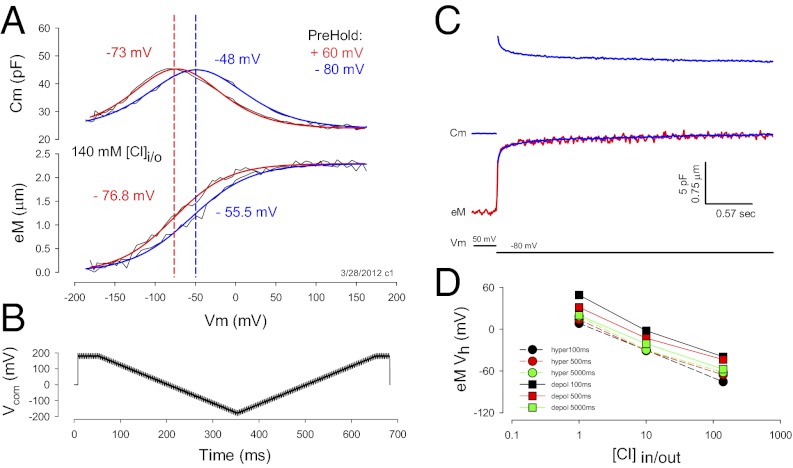
Nonlinear capacitance and eM are coupled. (A) OHCs possess a capacitance that is nonlinear with voltage. Its peak resides at a voltage, Vh, that changes depending upon holding potential. In this case, Vh is −73 mV after holding the cell at +60 mV for one minute (red line). Vh shifts to −48 mV after holding the cell at −80 mV for one minute (blue line). Similar shifts are observed for eM. Fits: (red) NLC Vh −73.10, z 0.69, Qmax 3.15, Clin 23.86; eM Vh −76.81, b 33.96, eMmax 2.42; (blue) NLC Vh −48.76, z 0.63, Qmax 3.42, Clin 23.90; eM Vh −55.48, b 37.13, eMmax 2.41. (B) Voltage stimulus used for the collection of capacitance and eM. Dual sine superimposed on ramps is used to evaluate Cm (Methods). Measures shown in A were obtained with hyperpolarizing ramps. The effects of ramp duration and polarity are described in subsequent figures. (C) A step voltage from 50 to −80 mV induces an elongation of the OHC (red trace) and simultaneous jump in Cm (blue trace). Cm relaxes with a stretched (multi) exponential time course that is mirrored by eM. The Cm trace was inverted, scaled and overlaid onto the eM trace (blue trace on red), showing similar time courses. (D) eM shifts in the depolarizing direction when intracellular chloride is reduced. The eM and NLC were measured simultaneously with hyperpolarizing and depolarizing ramps at the indicated ramp durations/rates. Regardless of polarity or rate, a large shift of Vh is observed, but the absolute values of Vh are more depolarized with longer depolarizing ramps. Number of cells averaged is the same as indicated in Fig. 3 A–C. SEs are not plotted for clarity. They are for 1, 10, and 140 mM Cl: black squares, 4.5, 3.7, and 3.8 mV; red squares, 5.0, 3.8, and 2.7; green squares, 7.3, 3.8, and 9.6; black circles, 4.6, 4.2, and 3.8; red circles, 3.5, 5.2, and 4.3; and green circles, 5.4,6.0,and 10.6.

