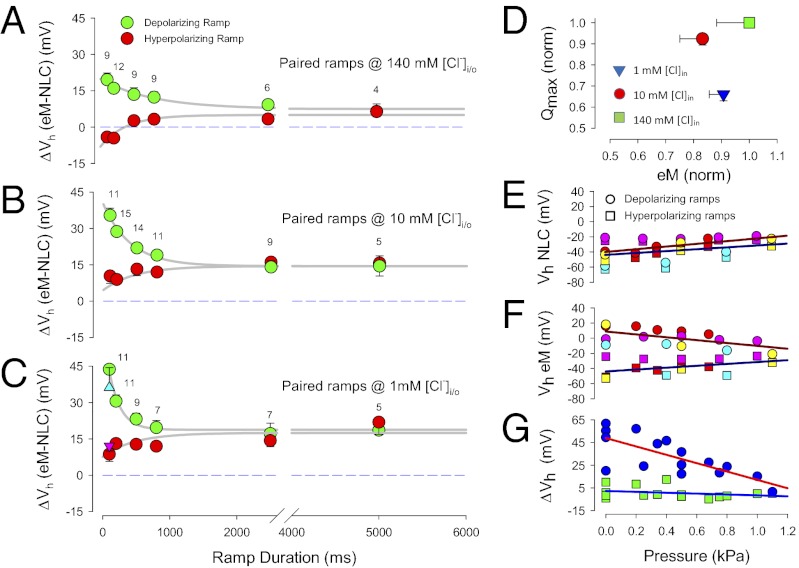
Fig. 3.
The eM and NLC are disparate. (A) The eM and NLC operating voltage disparities are dependent on chloride levels, ramp durations/rates, and polarity. With 140 mM chloride intracellular, polarity effects are symmetrical but offset in the depolarizing direction. (B) For 10 mM chloride, the offset is larger, and a depolarizing asymmetry arises at short ramp durations. (C) With 1 mM chloride, the depolarizing offset is larger still, and the depolarizing asymmetry at short ramp durations is also greater. Errors bars are SE and numbers of cells are indicated. Triangles (up, blue: depolarizing ramp; down, purple: hyperpolarizing ramp) depict results obtained with aspartate as the chloride substitute at 100 ms duration ramp. Compare with model results in Fig. 5 B–D. (D) Qmax and eMmax are not strictly correlated. Normalized Qmax and eMmax are derived from 500 ms hyperpolarizing ramp data. As chloride levels decrease, Qmax decreases, but eM does not follow. Error bars are SE, number as in Fig. 3 A–C. Compare with model results in Fig. 5E. (E) Membrane tension reduces Vh disparity between eM and NLC. Vh of NLC shifts in the depolarizing direction with increase in membrane turgor pressure regardless of ramp polarity. (F) Vh of eM also shifts in the depolarizing direction with hyperpolarizing ramps as tension increases. However, eM Vh shifts in the hyperpolarizing direction when measured with depolarizing ramps. (G) Net effect of shifts in Vh is to reduce Vh disparity as membrane tension increases. ΔVh obtained by subtraction of data in A and B; n = 4. Compare with model results in Fig. 5 F–H.

