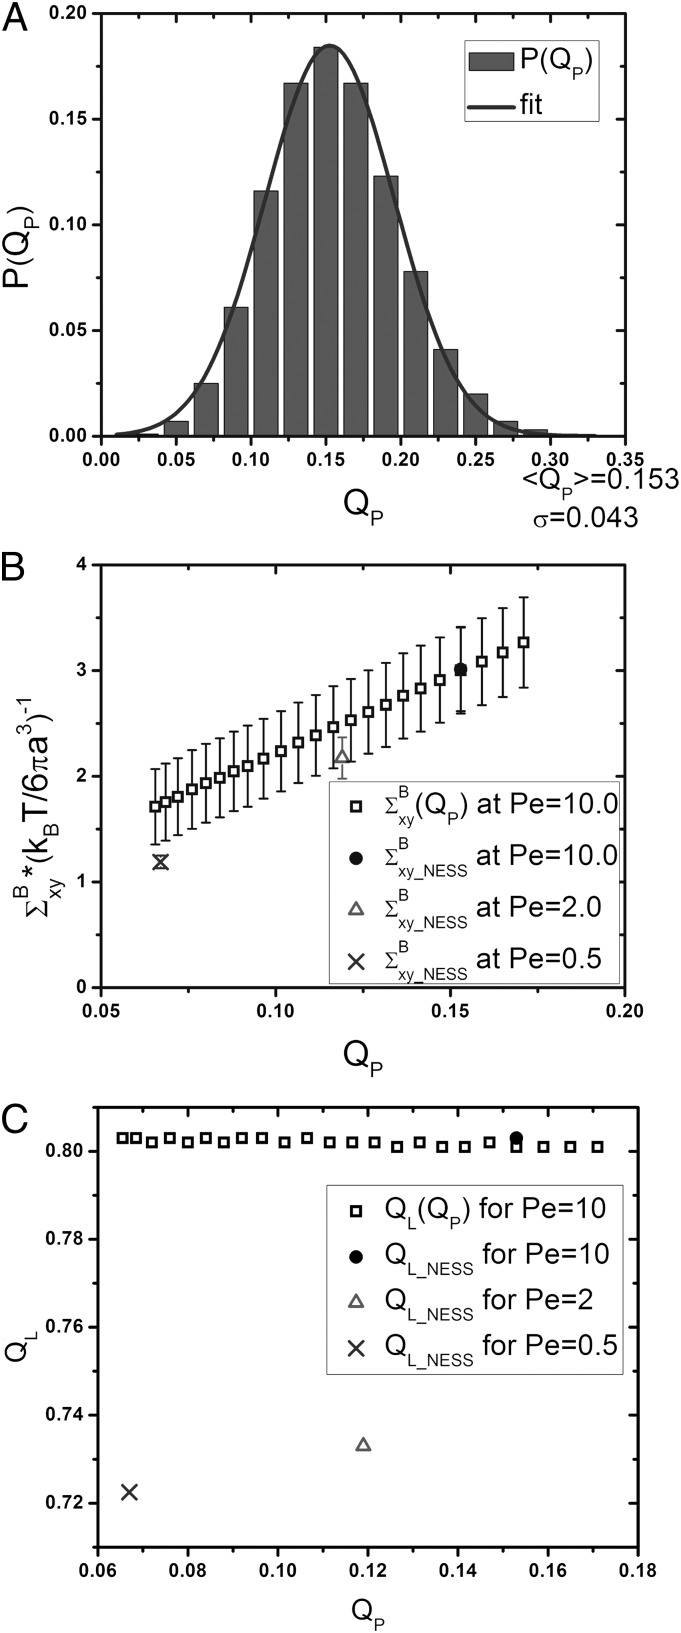
Fig. 5.
Structural signature for shear thinning. (A) Histogram of  for 100,000 steady-state configurations of the suspension with
  and
and  (bars), fitted to a Gaussian function (line) with average value
  and SD
  . (B) The xy component of the Brownian stress contribution
  as a function of
  for suspensions with
  and
and  (empty squares), compared with
  . (C) The layering of the suspension as described by scalar
  as a function of
  for suspensions with
  and
and  (empty squares), compared with
  , the steady-state average of
  at different
  . Each data point shown in B is the average of 100 independent simulations, and the bars show the SD.

