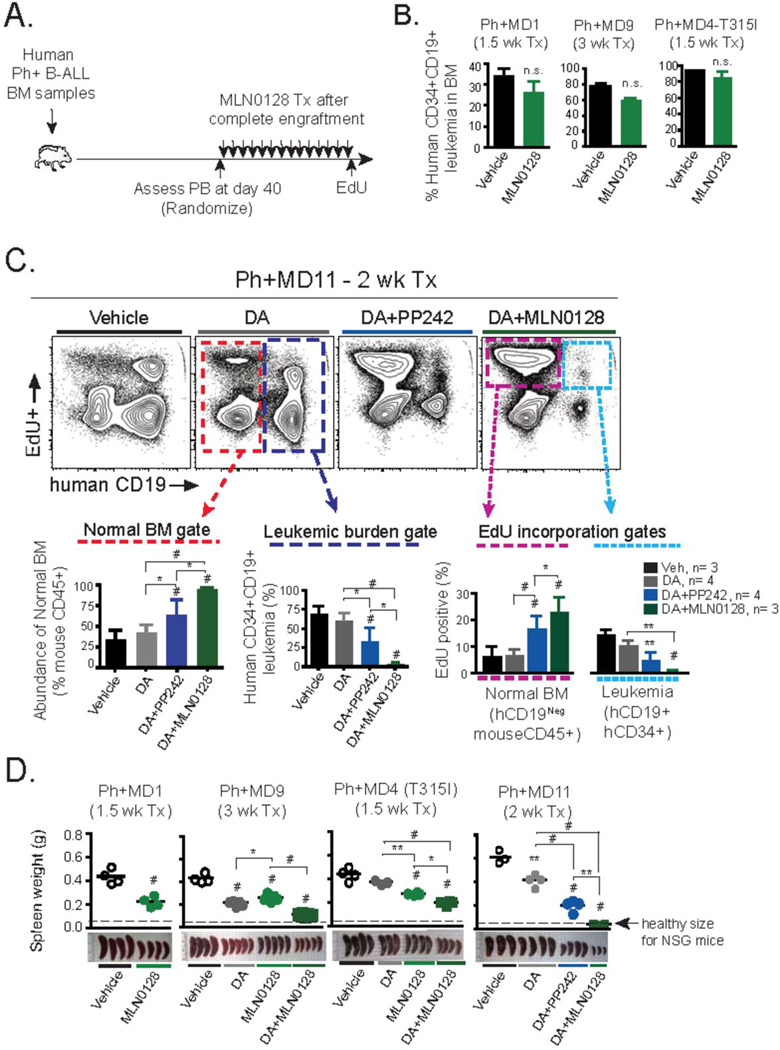
Figure 4. In vivo effects of MLN0128 in primary human Ph+ B-ALL xenografts.
(A) Schematic outline of Ph+ B-ALL xenograft model and treatment design. Three primary BM samples from dasatinib (DA)-resistant Ph+ B-ALL clinical specimens containing >90% CD45+CD34+CD19+ leukemic blasts were injected intravenously into NOD-SCID-γc−/− (NSG) mice. Following ~40 days, equally engrafted mice (>30% human blasts in peripheral blood) were randomized and treated with the indicated schedule for 1–3 weeks. Animals were injected with EdU (0.5 mg, i.p.) 1 hr before being euthanized, to mark actively cycling cells. (B) Xenografts of Ph+ samples MD1, MD9, and MD4 were treated with MLN0128 (0.75 mg/kg/day, p.o.) for the indicated time period. Percentage of human leukemia in BM was determined by flow cytometry. (C) Xenograft of Ph+ sample MD11 was treated for 2 weeks with DA (5 mg/kg/day, p.o.), or DA in combination with MLN0128 (0.75 mg/kg/day, p.o.) or PP242 (60 mg/kg/day, p.o.). Flow cytometry analysis of the BM is depicted. Dotted gates depict either normal resident endogenous mouse BM cells used to quantify hematopoietic recovery (lower left panel in red), percentage of human CD34+CD19+ leukemic burden (lower middle panel in dark blue), and to quantify EdU incorporation ability of endogenous mouse CD45+ BM cells (magenta) or human CD34+CD19+ leukemic cells (light blue) dotted gates are depicted (lower right panel). (D) Weight and gross pathology of spleens following indicated treatment schedules; note average spleen weight of healthy age-matched NSG mice. Note: data from MD11 xenografts (comparing vehicle, DA and DA + PP242) were shown in a previous publication (9), but the DA + MLN0128 condition from the same experiment was not included at that time. * P <0.05, ** P <0.01, # P <0.001, 2-way ANOVA.

