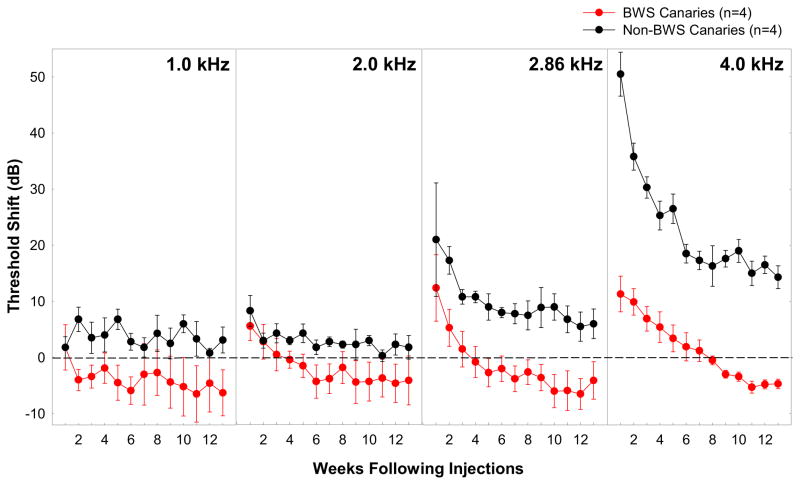
Figure 2.
Mean threshold shifts at 1, 2, 2.86, and 4 kHz for four BWS (red circles) and four non-BWS (black circles) canaries for thirteen weeks following injections. Threshold shifts were calculated for each individual relative to their pre-injection threshold at that frequency. The horizontal dotted lines represent those pre-injection thresholds for both groups at 0 dB. Error bars represent between-subject standard errors. (data from three BWS published previously Dooling et al. 1997)

