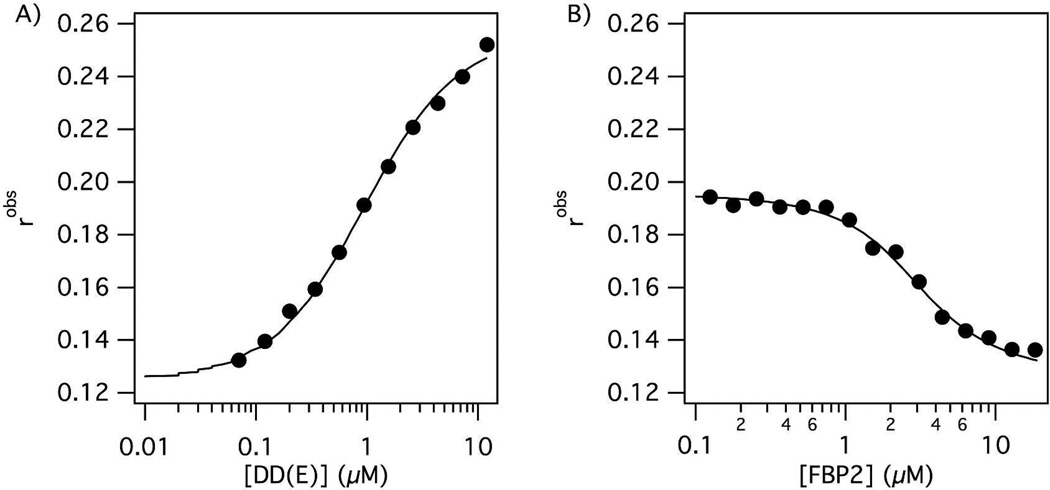
Figure 1.
A) Binding curve of TRITC-Tn6 peptide (0.1 µM) to DD(E) protein fragment. The observed fluorescence anisotropy increases as the concentration of free probe decreases. B) The displacement of TRITC-Tn6 peptide (0.2 µM) from DD(E) (2 µM) by a competitor peptide (FBP2) results in a decrease in observed fluorescence anisotropy which is used to calculate the inhibition constant Ki.

