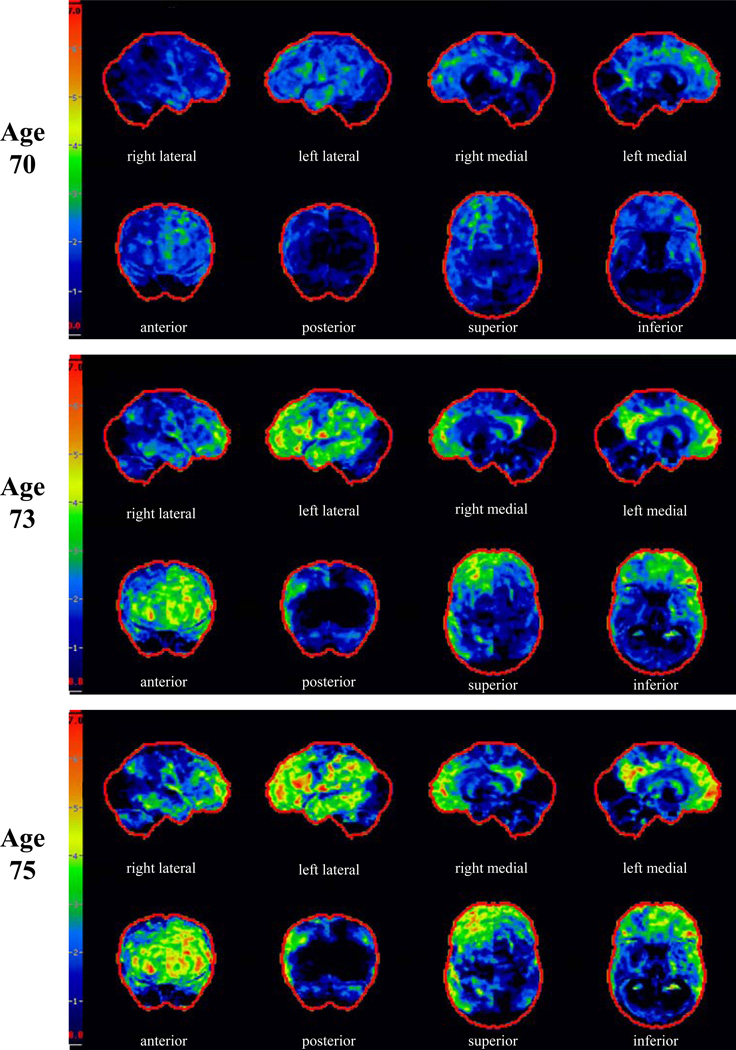
Figure 3. FDG-PET Scan.
FDG-PET scans at ages 70, 73 and 75. The images from left to right represent Z-score projection maps. Top rows: right lateral, left lateral, right medial, and left medial. Bottom rows: Anterior, posterior, superior, and inferior where the right side of the brain corresponds to the left side of each image. Note that the initial FDG-PET scan shows mild hypometabolism primarily involving the medial and dorsolateral frontal and lateral temporal lobes, left more so than right. Over time, the scans show progression of fronto-temporal hypometabolism, worse on the left, with involvement of the posterior cingulate cortex. The cerebellum is slightly affected at ages 73 and 75 as well.

