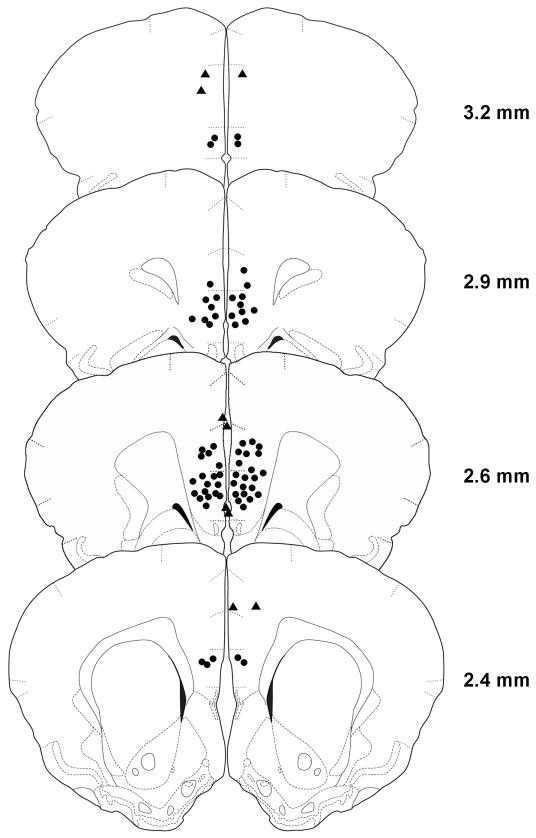
Figure 3.
The location of vmPFC injection sites is shown using illustrations adapted from a hamster stereotaxic atlas [55]. The distances shown for each illustration are relative to bregma. Black circles indicate the approximate placement of injection sites within the vmPFC. Black triangles represent misplaced injection sites. Circles and triangles may represent more than one individual.

