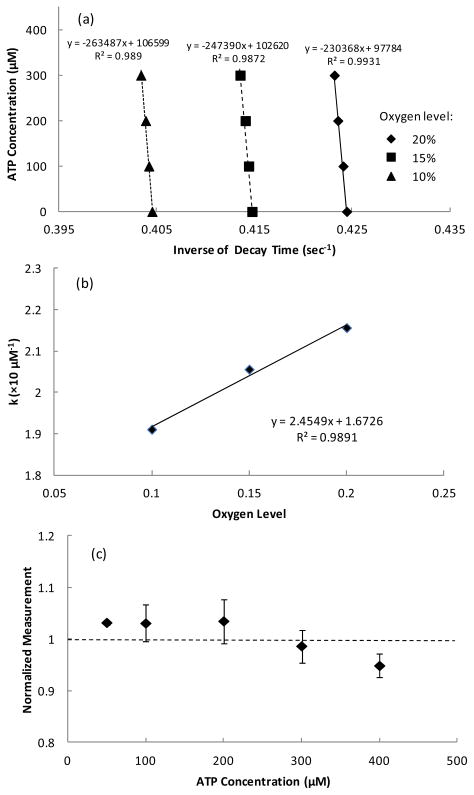
Figure 4.
(a) Typical calibration curves obtained at different oxygen concentration and (b) the corresponding linear relationship between the parameter k and oxygen concentration. (c) Accuracy of the oxygen compensation method on determination of ATP concentration at 15% oxygen level using the parameters obtained from the calibration tests at 10% and 20% oxygen levels (n=3). The data were normalized to the corresponding ATP concentration and expressed as mean values ± standard deviation in (c).

