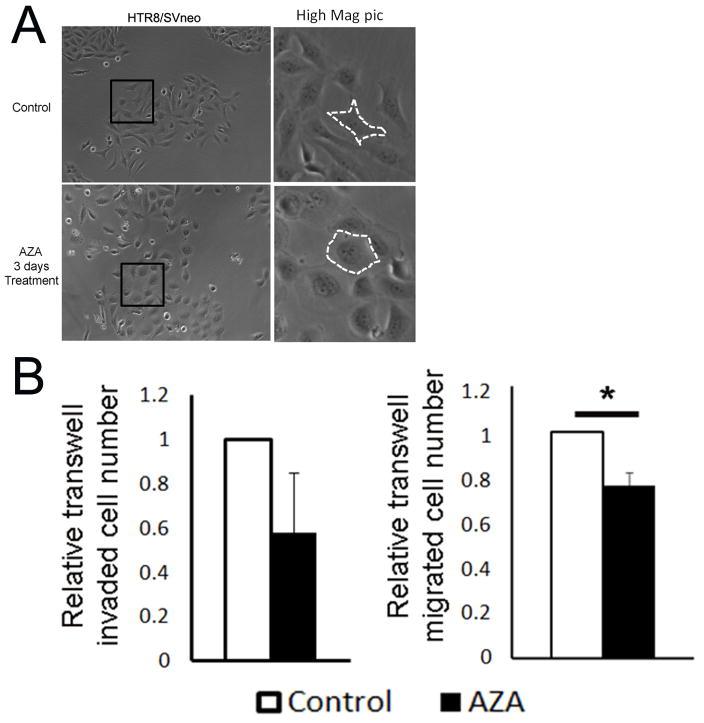
Figure 2.
5-aza-dC (DNMTs inhibitor) treatment induces changes in morphology and invasion/migration capacity indicative of MET. A. Morphology of 5-aza-dC treated HTR8/SVneo cells. Original picture is 200X. The white lines indicate cell boundary. B. 5-aza-dC treatment compromises cell invasion and migration capabilities. Data is presented as mean ± SEM. Asterisk (*) denotes statistically significant differences between 5-aza-dC treatment vs. control group.

