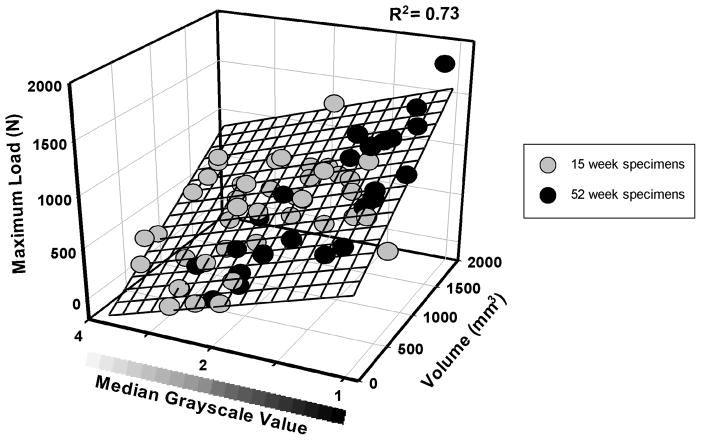
Fig. 3.
The reconstructed, repaired and transected ligament prediction plane for maximum load as a function of volume and of median grayscale value. The ligaments at 52 weeks (black circles) had a significantly lower median grayscale value than ligaments at the 15 week time point (gray circles) (p≤0.001). Similar plots were found for the yield load and the linear stiffness prediction models.

