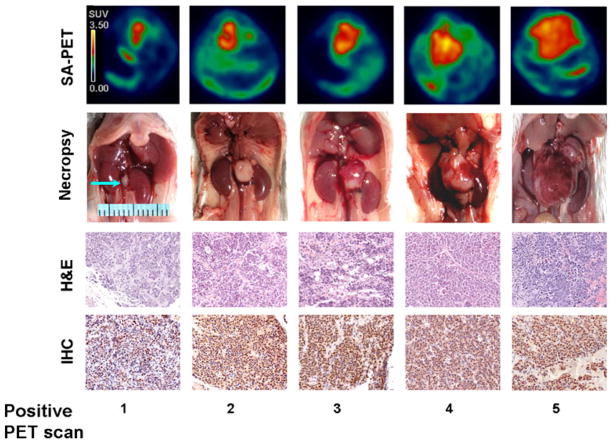
Fig. 2.
SA-PET and ex vivo analysis of tumor progression in TH-MYCN mice. Comparison between SA-PET and ex vivo analysis of tumor progression in TH-MYCN mice. SA-PET imaging (axial view), autopsy, H&E staining, and immunohistochemistry with monoclonal anti-N-Myc antibody (IHC) are shown in mice analyzed at five different stages of PET positivity. Radioactive counts in SA-PET images are expressed as SUV.

