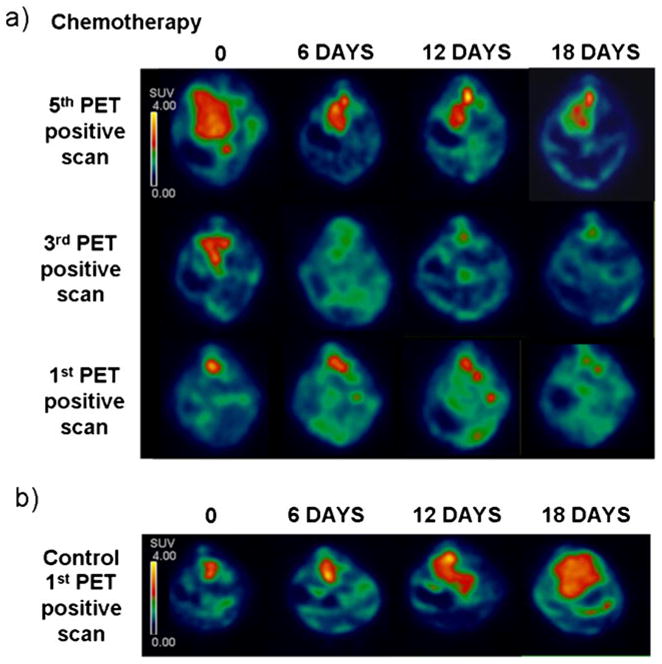
Fig. 5.

SA-PET analysis of tumor regression after chemotherapy treatment in TH-MYCN mice. a SA-PET images (axial view) of three TH-MYCN mice treated with a chemotherapy cocktail against neuroblastoma. Chemotherapy treatment started after the fifth PET positive scan in mouse 1 (top), after the third PET positive scan in mouse 2 (middle), and after the first PET positive scan in mouse 3 (bottom). SA-PET scanning has been repeated in these mice after 6, 12, and 18 days from the starting of chemotherapy. Radioactive counts are expressed as SUV. b Control TH-MYCN mouse analyzed by SA-PET images after 6, 12, and 18 days from the first PET positive scan. Radioactive counts are expressed as SUV.
