Figure 5.
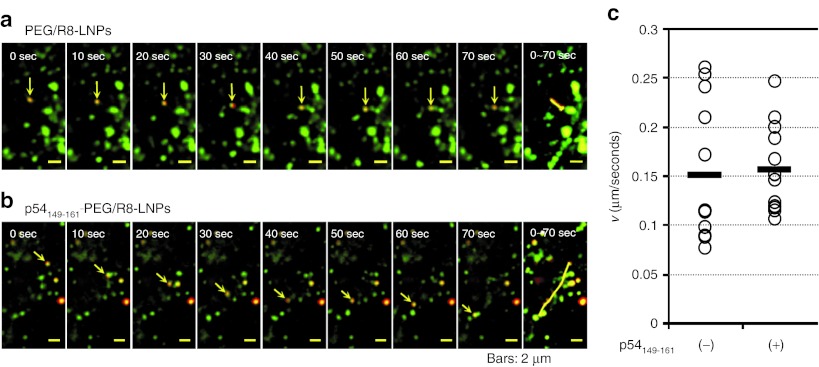
Dual imaging of vesicular transport and LNPs. (a and b) Typical images for the directional transport of PEG/R8-LNPs (a) and p54149-161-PEG/R8-LNPs (b) encapsulating rhodamine-labeled pDNA. Rhodamine-pDNA was represented as red. The transport vesicles stained with PKH67 are represented as green. In the rightmost column, overlay images were represented to show the trajectories. (c) The average velocities (v) obtained by the curve fitting of MSD-Δt curves for quasi-straight trajectories of PEG/R8-LNPs (n = 12) and p54149-161-PEG/R8-LNPs (n = 12) was plotted. Black bars represent the mean values. PEG, polyethylene glycol.

