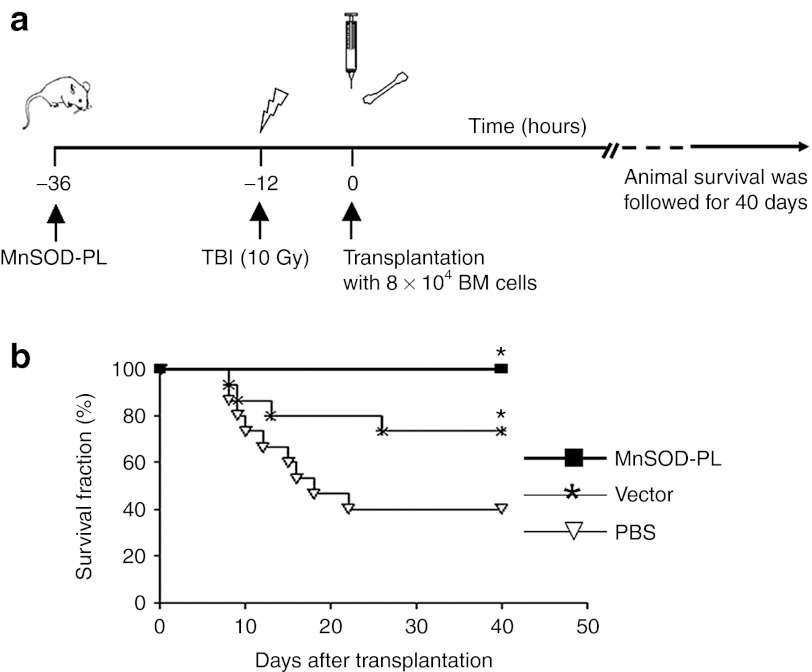
Figure 2.
Survival rates of mice transplanted with a limiting dose of BM cells. (a) Schematic representation of the experimental design. (b) Survival curves of mice following BM transplantation (n = 15 per group). There is a significant difference among MnSOD-PL, mock vector control, and PBS control groups (*P < 0.05). BM, bone marrow; MnSOD-PL, manganese superoxide dismutase-plasmid and lipofectin complex; PBS, phosphate-buffered saline; TBI, total body irradiation.

