

Abstract
Genotoxicity models are extremely important to assess retroviral vector biosafety before gene therapy. We have developed an in utero model that demonstrates that hepatocellular carcinoma (HCC) development is restricted to mice receiving nonprimate (np) lentiviral vectors (LV) and does not occur when a primate (p) LV is used regardless of woodchuck post-translation regulatory element (WPRE) mutations to prevent truncated X gene expression. Analysis of 839 npLV and 244 pLV integrations in the liver genomes of vector-treated mice revealed clear differences between vector insertions in gene dense regions and highly expressed genes, suggestive of vector preference for insertion or clonal outgrowth. In npLV-associated clonal tumors, 56% of insertions occurred in oncogenes or genes associated with oncogenesis or tumor suppression and surprisingly, most genes examined (11/12) had reduced expression as compared with control livers and tumors. Two examples of vector-inserted genes were the Park 7 oncogene and Uvrag tumor suppressor gene. Both these genes and their known interactive partners had differential expression profiles. Interactive partners were assigned to networks specific to liver disease and HCC via ingenuity pathway analysis. The fetal mouse model not only exposes the genotoxic potential of vectors intended for gene therapy but can also reveal genes associated with liver oncogenesis.
Introduction
Stable integration into the host genome by retrovirus vectors (RV) has rendered these vehicles as ideal candidates for permanent therapeutic gene delivery. Because active genes in the host are considered targets for insertion, RV infection carries the risk of mutation leading to oncogenesis, as demonstrated in preclinical models and gene therapy clinical trials.1,2,3 In vitro clonal assays and in vivo models have been adapted to assess the genotoxic potential of individual viral vectors.4,5 Those models that include a tumor prone mouse model have been successfully used to target oncogenes and tumor-suppressor genes on RV or transposon integration and have been demonstrated to be capable of revealing vector-related genotoxic factors that include vector insertion preferences, vector dose, and configuration and possible transgene involvement in oncogenesis.6,7,8,9 Although self-inactivating (SIN) lentiviral vectors (LV) are generally considered safer than γ-RV for gene therapy10,11 recently, clonal expansion has been associated with LV following integration into the HMGA2 gene accompanied by highly elevated HMGA2 expression in a patient treated for β-thalassaemia.12
Currently, little is known about the potential for presumably subtle RV or LV-mediated side effects on the host following nontargeted, somatic gene transfer where several unperturbed cell types with differing spatial and temporal gene expression profiles are exposed to the risk of insertional mutagenesis. Hence, there is an important need for models to predict the side effects of gene therapy application directly in vivo.
In a previous report, we described our unexpected finding that MF-1 outbred mice treated in utero at the E16 fetal stage of development with SIN configuration nonprimate equine infectious anemia virus (EIAV) LVs developed hepatocellular carcinomas (HCCs) at high frequency, whereas mice treated in a comparative setting with a SIN primate HIV-1-based vector did not. These mice have a normal genetic background and are not predisposed to tumor development. As the majority of the HCCs found were clonal derived with provirus insertions in or close to RefSeq genes that were mostly associated with cancer, we suspected insertional mutagenesis to have caused liver disease.13 This was suspected because during development genes involved in cell cycle, differentiation, metabolism, and defense are in a highly transcriptional and proliferative state; so, we hypothesized that RV and LV insertion may have occurred in such genes that control these processes that are known to be involved in oncogenesis.14
It was, however, suggested that differences between the truncated X gene sequences included in the woodchuck post-translation regulatory element (WPRE) that would allow X expression from the nonprimate (np) LV vector but not the primate (p) LV vector could be the cause of the different outcomes in the fetally treated adult mice because the X gene in its wild-type form is known to be involved in HCC development.15
The findings presented here, follow on from our previous work and describe the usefulness of the MF-1 mouse that is a fully immunocompetent outbred strain that is not predisposed to tumor development as genotoxicity model. In this study, we first address the question of possible vector-associated WPRE involvement in HCC and report that even with WPRE mutations in the npLV similar to those used in the pLV to abolish X gene expression, HCC still develops at high frequency.
We next profile the insertion sites of the npLV and pLV-based vectors and relate these to the genes that are transcriptionally active in the fetus to find clues as to the cause of oncogenesis restricted to the npLV. We also show that tumor development is not only associated with the EIAV LV used but also with an alternative npLV based on the feline immunodeficiency virus (FIV) gene therapy vector. Our data suggest that LV application to the mouse fetus in utero can be valuable to identify gene therapy vectors with genotoxic potential before clinical application and useful to discover genes involved in complex liver disease pathways.
Results
Tumor development in fetal mice treated with nonprimate LV
We investigated the involvement of the truncated X (tX) gene in the WPRE sequence to cause oncogenesis in the in utero treated mice by using LVs with and without mutations in the promoter and start codon of the tX gene to prevent tX expression. The hypothesis that tX was the cause of oncogenesis was based on the previously shown fact that EIAV SMART npLVs without these mutations were associated with HCC, whereas the HIV HR'SIN-cPPT-S-FIX-W pLV with these mutations was not. Hence, a modified-SMART vector, SMART 2ZWΔ with X promoter, and start codon mutations were tested alongside the original non-tX–mutated SMART 2Z vector in fetal mice. In addition, we used the original pLV HIV-based vector HR'SIN-cPPT-S-FIX-W and a pLV HIV-based vector RRL.SIN-cytomegalovirus (CMV)-FIX without the tX mutations. In addition, to determine whether oncogenesis was restricted to the EIAV SMART 2 npLV, we introduced a FIV-derived vector pLION11-hAAT-e green fluorescence protein (GFP) into our study as an alternative npLV that had tX mutations identical to those described previously HR'SIN-cPPT-S-FIX-W.16 Each vector was injected into E16 gestation fetal mice at similar doses shown in Table 1. Vector configurations are shown in Figure 1. All animals were palpated weekly to determine tumor development, and those suspected to be tumor positive were subjected to internal examination by laparotomy. Liver tumors were found only in SMART 2Z (n = 4/6), SMART 2ZWΔ (n = 4/10), and pLionII-hAAT-eGFP (n = 3/8)-treated animals from 127 to 715 days of age and not in the HIV pLV-treated mice (n = 31) (Table 1 and Figure 2). One of the FIV-treated mice developed an ovarian tumor without sign of a liver tumor and was killed at day 715. No tumors developed in the vector buffer treated control animals (n = 3). Only one mouse at an age of 568 days of >500 untreated MF-1 mice ranging from 3 months to 2 years of age was identified with a spontaneously occurring HCC in our laboratory. Survival data for mice used in this study are shown in Supplementary Figure S1 and includes mice treated with SMART 2hFIX previously described that developed HCCs.13
Table 1. Details of mice injected with lentivirus vectors.
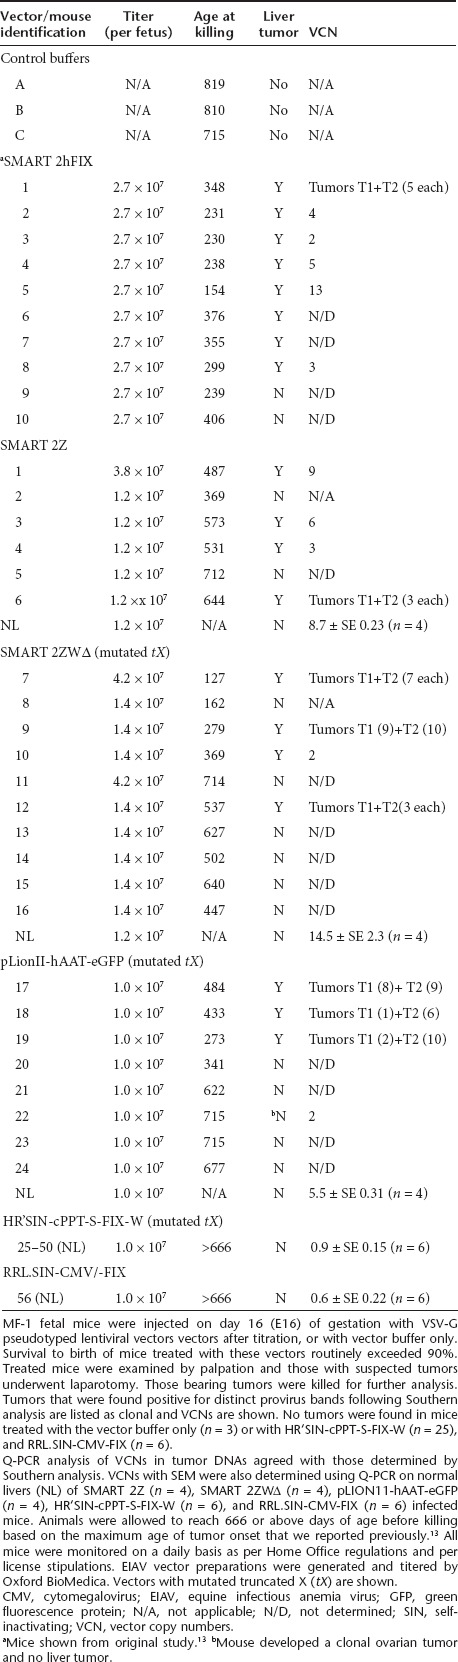
Figure 1.

Schematic representation of lentivirus vectors. Equine infectious anemia virus (EIAV) SMART 2Z, and SMART 2ZWΔ, HIV HR'SIN-cPPT-S-FIX-W and RRL.SIN-CMV-FIX/GFP and FIV pLION11-hAAT-GFP vector genomes. Each vector has been previously described.13,18,33 SMART 2ZWΔ is identical to SMART 2Z except that it carries mutations in the X gene promoter and start codon present in the woodchuck post-translation regulatory element to abrogate tX gene expression. The pLION11-hAAT-eGFP vector is based on the FIV and carries identical mutations in the X gene promoter and start codon in HR'SIN-cPPT-S-FIX-W as previously described.16 The RRL.SIN-CMV/-FIX or GFP vectors like SMART 2Z do not have mutations in the X gene to prevent tX expression. Each vector contains SIN LTR configuration and cPPT. An internal SFFV promoter in HR'SIN-cPPT-S-FIX-W drives human factor IX (hFIX) gene expression; SMART 2Z and SMART 2ZWΔ use the CMV promoter to drive β-galactosidase gene expression; pLION11-hAAT-GFP drives GFP expression using the human α1 antitrypsin promoter; and in RRL.SIN-CMV/-FIX or GFP the CMV promoter drives hFIX expression. CMV, cytomegalovirus; FIV, feline immune-deficiency virus; GFP, green fluorescence protein; LTR, long terminal repeat; PPT, polypurine tract; RRE, rev response element; SFFV, spleen focus forming virus; SIN, self-inactivating.
Figure 2.

Macroscopic and microscopic analysis. Representative photomicrographs of tumors that developed in the fetally treated adult mice.These appear to closely match those described in our previous study as solid masses surrounded by normal liver tissue. (a) SMART 2ZWΔ-treated mouse 10 liver with tumor (killed at 369 days) (original magnification ×10); (b) β-galactosidase expression in EIAV mouse 10 tumor (original magnification ×40); (c) SMART 2ZWΔ infected mouse 9 (killed at day 279) tumor with speckled staining of cells in foci positively expressing β-galactosidase (original magnification ×40); (d) SMART 2ZWΔ-infected mouse 7 (killed at day 127) tumor also with speckled β-galactosidase expression (original magnification ×40); (e) EIAV mouse 7 normal liver stained for β-galactosidase expression (original magnification ×40). (f) Representative liver tumors that developed in mouse 18 treated with feline immunodeficiency virus vector pLION11-hAAT-eGFP (original magnification ×10); (g) Anti-GFP immunostaining of mouse 18 hepatocytes infected by pLION11-hAAT-eGFP. Approximately 50% of cells appear positively for GFP expression (original magnification ×100); (h) Immunostaining for GFP in RRL.SIN-CMV-GFP infected cells shows ~20% express GFP (original magnification ×100). Histological analysis; (i) Representative normal liver tissue of a vector buffer only treated mouse at 715 days with fatty degeneration and normal hepatocyte morphology (hematoxylin and eosin staining, original magnification ×100); (j) Liver of EIAV SMART 2Z-treated mouse 4 killed at 531 days also with normal hepatocyte morphology and fatty degeneration (hematoxylin and eosin staining, original magnification ×100); (k) Mouse 4 hepatocellular carcinoma (HCC) showing a trabecular architecture of tumor cells (hematoxylin and eosin staining, original magnification ×100); (l) High-power magnification of EIAV SMART 2Z mouse 1, killed at 487 days, HCC with abnormal mitosis and dysplastic cells around central vein (hematoxylin and eosin staining, original magnification ×200); (m) EIAV SMART 2ZΔW-treated mouse 7 killed at 127 days with HCC showing a cross-section of the liver with a border between normal liver and tumor (hematoxylin and eosin staining, original magnification ×40); (n) Mouse 7 HCC with widespread polymorphic tumor cells (hematoxylin and eosin staining, original magnification ×100). All livers of HIV HR'SIN-cPPT-S-FIX-W and RRL.SIN-CMV-FIX pLV HIV-treated mice appeared normal morphologically and histologically. CMV, cytomegalovirus; EIAV, equine infectious anemia virus; GFP, green fluorescence protein; LV, lentiviral vectors; SIN, self-inactivating.
Histological examination of tumors and vector gene expression
Mouse tumors, their respective normal livers, and control uninfected mouse livers were subjected to histological examination to characterize their liver architecture. Each of the liver tumors was identified as a HCC represented by trabecular architecture, cellular polymorphism, and abnormal mitosis (Figure 2i–n). Normal liver staining for β-galactosidase expression by the CMV promoter in SMART 2Z and SMART 2ZWΔ closely matched our previously reported findings using the SMART 2Z vector after in utero injection with 10% of hepatocytes showing positive for β-galactosidase expression.17 GFP expression driven by the hAAT promoter in pLionII-hAAT-eGFP and the CMV promoter in RRL.SIN-CMV-GFP provided obvious GFP fluorescence, in 50% and 20% of hepatocytes, respectively, in the mice treated with these vectors (measured at 3.5 and 5 months, respectively) (Figure 2g,h). Human factor IX gene expression in the blood of mice treated with HR'SIN-cPPT-S-FIX-W ranged between 2.1–23.7% (week 1 bleed) and 2.1–39.75% (week 71 bleed) of the hFIX levels found in normal human plasma nearly matched our findings by enzyme-linked immunosorbent assay in mice treated with this vector.18 Although we found high-hFIX levels driven by RRL.SIN-CMV-FIX in D17 cells infected in vitro with this LV, in mice fetally treated with this vector, low levels of hFIX gene expression was found by enzyme-linked immunosorbent assay in two of six mice at 0.3% and 0.4% of normal human FIX levels at 1 month and no expression was found at the 6-month time point. Immunostaining of hepatocytes for hFIX expression by RRL.SIN-CMV-FIX found ~10% hepatocyte transduction (data not shown).
HCCs are composed of clonally derived cells mixed with polyclonal cells
To determine vector clonality in HCCs, Southern analysis of provirus integration was performed that resulted in distinct bands for the SMART 2 vectors representative of clonally derived genomic DNA (Supplementary Figure S2). No bands were identified in the DNA of the suspected bone tumor that developed in a SMART 2ZWΔ-treated animal (mouse 15) (Supplementary Figure S2), and we suspected the bone tumors in this mouse either to have arisen spontaneously or may have had lost vector sequences during development. Each of the liver tumors in the pLionII-hAAT-eGFP FIV-treated mice were also found to be clonal (data not shown) as was the ovarian tumor that developed in the pLionII-hAAT-eGFP-treated mouse where no liver tumor was identified (mouse 22). By this analysis, we found vector copy numbers (VCN) in the EIAV and FIV-derived tumors were between 1–6 and 1–5, respectively.
Despite loading equal amounts of SMART 2 vector-derived tumor DNAs (10 µg) to agarose gels before Southern analysis and repeating several times (n = 5), band intensities differed significantly after hybridization. This suggested the tumors were composed of clonal cells mixed with heterogeneous polyclonal cell populations present in the tumor masses (Supplementary Figure S2). This was also obvious by the speckled β-galactosidase expression identified macroscopically in these tumors (Figure 2). In contrast, tumors that developed in FIV-treated mice had clear banding patterns after Southern analysis with no variations in band intensities (data not shown). GFP expression in these tumors was also highly intense and uniform throughout each tumor (data not shown).
The animals treated in this study received similar vector doses (between 1 × 10⁷–4.2 × 10⁷ vector particles); however, only EIAV and FIV vector-treated mice developed tumors (Table 1). VCN averages were measured using real-time PCR. VCNs with SEM for SMART 2Z were found to be 8.7 ± SE 0.23 (n = 4), SMART 2ZWΔ 14.5 ± SE 2.3 (n = 4), pLION11-hAAT-eGFP 5.5 ± SE 0.31 (n = 4), HR'SIN-cPPT-S-FIX-W 0.9 ± SE 0.15 (n = 6), and for RRL.SIN-CMV-FIX 0.6 ± SE 0.22 (n = 6). The VCNs found in the HIV LV-treated animals closely matched those in our previous studies;13,18 however, the SMART 2 VCNs found in this study appeared significantly higher than in our previous study where we first described oncogenesis with these vectors. These findings demonstrate the difficulties we experienced in controlling vector dose to the liver following vector administration at this gestation. VCNs in the tumors of the npLV-treated mice were in good agreement with those found by Southern analysis. The ages of the mice that developed tumors are provided in Table 1. Using this data and that from our original study no correlation was found between VCN and age of liver tumor onset. Measurement of the clonality of these tumors is provided below that followed the identification of SMART 2 insertions in genes in tumors by linear amplification-mediated (LAM) PCR and DNA sequencing.
Tumor insertions occur in cancer-associated genes at high frequency
Then, we examined tumor clonality in greater detail by identifying the positions of virus insertions with respect to RefSeq genes in the mouse genome using LAM PCR and DNA sequencing. In total, provirus-genomic DNA junctions were sequenced from five EIAV-derived tumors; two by Sanger and Coulson sequencing, two by 454 pyrosequencing, and one by both methods. Insertion sites were also retrieved from six FIV-derived tumors and sequenced by the Sanger and Coulson method only.
To generate sets of provirus integrants from the normal livers of EIAV and HIV-treated mice, we used LAM PCR and 454 pyrosequencing on the normal livers of the three SMART 2-treated mice (from which we had retrieved vector insertions from their tumors) and on two normal livers from HR'SIN-cPPT-S-FIX-W-treated animals. These data were then used for comparative analysis of the insertion profiles between EIAV and HIV vectors in the fetal mouse genome. Of note, this data were generated at the end of the study at the time of killing and may be influenced by clonal outgrowth in the liver caused by vector genotoxicity.
To obtain vector insertions, all LAM-PCR amplicon sequences were aligned to the mouse genome using BLAST (http://blast.ncbi.nlm.nih.gov/) and BLAT searches (http://genome.ucsc.edu/). Using a 100 kb insertion site interval, integration site sequencing confirmed the clonal nature of the developed HCCs mixed with nonclonal cells. As deep sequencing efficiently retrieves integration sites from polyclonal cell populations not involved in tumor formation in addition to those involved in tumorigenesis, we subtracted tumor versus nontumor relevant integrants by using the retrieval frequency of each integrant. The higher the identical sequence count for each integrant, the higher the likelihood of it being clonal and tumor associated. Using sequence count data we were then able to calculate the percentage of cells with clonal insertions in the three deep sequenced tumors relative to all infected cell populations in each tumor. For the three tumors examined, these percentages were 25.7, 49.9, and 3.9. These values, however, do not include untransduced cells recruited to the tumors.
Using each sequencing method, from the five EIAV and six FIV-associated tumors, we obtained a total of 16 and 23 clonal integrations in RefSeq genes, respectively. Of these, 56% were either in known oncogenes, associated with oncogenes, or involved in tumor suppression. We next identified the molecular function and role in biological processes for each gene using the gene ontology (GO) database. Each gene was also examined for inclusion in the Mouse Retroviral Tagged Cancer Gene Database (RTCGD, http://RTCGD.ncifcrf.gov) and for its relationship to oncogenesis (Supplementary Table S1). A total of 25 genes were found with known involvement in cancer and 13 specifically with HCC. Seven of these genes or family members were also found listed in the RTCGD.
Using both sequencing methods after LAM PCR on one of the tumors examined (mouse 1T2 from our previous study), both agreed that Park 7, Uvrag, and Rabgef genes were the clonal integration sites in this tumor (these genes were represented with closely matching sequence count by the 454 method). It is worth noting that Park7 is an oncogene and known to be involved in HCC;19,20 and Uvrag is a tumor suppressor important to autophagy21 and also involved in liver cancer.
We used locus-specific Q-PCR to measure the levels of clonality in two of the three tumors where LAM PCR followed by 454 sequencing had provided the identification of genes with EIAV LV insertions with high-sequence counts. From tumor 6T1 with insertions in Pah, loc382044, and Acvr2a, we measured the abundance of DNA-containing SMART 2Z in Pah; and from tumor 1T2 with insertions in Rabgef, Rnf 13, Uvrag, and Park 7, we measured the abundance of DNA-containing SMART 2Z in Uvrag. These genes were chosen due to their proximity of the vector to the gene that provided ideal conditions to design primer/probe sets for Q-PCR analysis. From this analysis using glyceraldehyde 3-phosphate dehydrogenase as the gene locus which would be expected in 100% of cells, we found the abundance of Pah and Uvrag insertions to be 35% ± 0.33 and 16% ± 0.23, respectively. Of note, these data reflect clonality in these tumors as compared with cell populations that are nonclonal with or without vector insertions.
Comparison of EIAV and HIV vector integration profiles in normal livers
At E16 to day 3 after birth, the period of time when vector integration was expected to have been completed, gene expression in the fetus is highly complex with many genes in a highly transcriptionally active state.14 These genes are known to be involved in control of liver development and proliferation and with known involvement in HCC.14 We suspected, therefore, that insertion into these genes by a potentially genotoxic vector may initiate outgrowth of subsets of cells and lead to liver disease. We therefore characterized and compared the insertion profiles of EIAV and HIV LVs in normal livers to look at differences in insertion site selection that could have contributed to clonal outgrowth and oncogenesis in the EIAV-treated mice.
A total of 839 EIAV and 244 HIV nonredundant insertions were retrieved. Of these, 642 (76.5%) and 193 (79%) insertions of EIAV and HIV, respectively, were located in or close to RefSeq genes (within a window of 100 kb), which is in agreement with previous investigations of the insertion site frequencies into RefSeq genes by these vectors.10,11,22,23,24 Using the 839 EIAV and 244 HIV nonredundant unique insertions, we made comparisons using the following parameters: (i) region within the inserted gene and relative to transcription start site, (ii) distance from the CpG island, (iii) regional CG content, (iv) chromosome preferences, and (v) regional gene density. Common insertions: hot spots for each vector were also identified. First, independent and randomized insertion data sets for EIAV and HIV were created by setting each vector insertion site randomly across the genome.25
As previously described for these LV vectors, each preferably integrated into the transcription unit and not near the transcription start site or CpG islands (Supplementary Figure S3a,b).10,11 In addition, as already described, EIAV and HIV insertions positively correlated with AT rich region selection (P < 0.001)11,26 with a 35–45% GC content around insertions using windows of 100, 250, 500, 750, and 1 kb on either side of each integrant. The 1 kb interval is shown as representative of every window that has identical behavior (Supplementary Figure S3c). For both vectors, in contrast to the random set, we found an uneven chromosomal distribution that was independent of chromosome size and gene density with HIV insertions in regions with lower gene density (0–59 genes/5 × 106 bp) than EIAV (30–120 genes/5 × 106 bp) (P < 0.0001) (Supplementary Figure S3d,e).
We then tried to identify hotspots of EIAV insertions in common insertion sites within a narrow 500 bp interval. Insertions were found in several genes located on different chromosomes one of which was in Uvrag that we already identified in a clonal HCC from our original study 13. Of note, GO assignment of the EIAV common insertion sites showed their gene products to be relevant to development, cell death, cycle, proliferation DNA replication/repair, cell signaling, and cancer (http://www.ncbi.nlm.nih.gov/) (Supplementary Table S2). Although HIV preference for insertion hotspots have been previously described,11,23 we found no integration hotspots for the HR'SIN-cPPT-S-FIX-W HIV vector even when we broadened our investigation for hotspots in a 100 kb interval around each insertion site. Using this insertion site, window EIAV hotspots were found in Park7, Cyp3A11, and Mrpl23 genes in addition to the Uvrag gene that was also identified in the clonal tumors13 (Supplementary Table S2). The hotspot region with most vector insertions (using the 500 bp interval) contained 13 EIAV insertions between the Ankrd17 and Alb genes clustered in a 115.3 kbp region on chromosome 5. In the 1 Mbp region around this region, we found six more EIAV insertions in the closely located Afm, Rassf6, and Cxcl1 cluster of genes (Supplementary Figure S4). These genes are among the most highly expressed during fetal development14 suggesting the insertion hotspots may represent a preference for EIAV integration in highly transcriptionally active genes of the fetal mouse. Alternatively, the identification of these hotspots may be as the result of clonal outgrowth of cells containing these insertions promoted by EIAV integration.
Correlation between vector insertions and gene expression in the fetus
To make comparisons between the LV gene insertion profiles and gene expression at the time of infection (E16 to day 3 after birth period), we aligned the unique 642 EIAV and 193 HIV RefSeq insertions with genes differentially expressed (either 1.5 up or 1/1.5-fold down) in the fetus. Using our previously reported microarrays covering expression levels over these time points14 and our RefSeq insertion site data, we made horizontal representations between the GOs for each gene data set. GOs were obtained using http://babelomics.bioinfo.cipf.es (log 10 P values >1.3 are taken as significant, P value <0.05 after Benjamini Hotchberg correction).27 This was repeated with the random insertion data (P values set at the 95% confidence interval) to determine significant deviation between experimental and random data sets (Figure 3). In contrast to HIV insertions and the random data set (P value <0.001) consistently for each gestational day, EIAV insertions appeared in genes with high levels of expression. This suggested, once again, that either different sets of genes were chosen for integration by each vector or that cells with genes carrying EIAV insertions became predominant in the liver possibly as a result of clonal outgrowth associated with vector genotoxicity.
Figure 3.

Vector insertions relative to fetal gene expression. A horizontal representation was generated between gene ontologies (GOs) of RefSeq genes with vector integrations during the E16 to postnatal day 3 (when integration was expected to occur) period and GOs of genes differentially expressed by 1.5-fold and above or decreased by 1/1.5-fold and below the average of all times points from E11.5 to adulthood in our fetal development microarray. GOs of EIAV and HIV RefSeq insertions were obtained using the Babelomics platform (http://babelomics.bioinfo.cipf.es) –log10 P values >1.3 are taken as significant (P < 0.05 after Benjamini Hotchberg correction).27 The number of genes in each Ref Seq GO was plotted, with the number of genes in the GOs of the random data set, against the expression levels of GOs representing the differentially expressed genes during the E16 to day 3 period. The expression levels of genes within each GO are represented in percentiles from low to high for each time point. Significant differences were identified for each vector compared with the random data (P value <0.001). EIAV insertion appears only in genes that are highly expressed whereas HIV vector insertions appear not to follow this trend with a more specific gene profile. The random data set shows no preference for gene expression levels of GOs. EIAV LV, infected data set (clear bar); EIAV R, random insertion data set (gray column); HIV LV, infected data set (black bar); HIV R, random data set (chequered bar). EIAV, equine infectious anemia virus; LV, lentiviral vectors.
To determine the importance of the genes found with vector insertions, the GOs representing RefSeq insertions were subjected to Ingenuity Pathways Knowledge Base software (IPA) analysis that provides information on biological processes overrepresented in each data set. P values <10−20 or lower were used to select highly significant overrepresentation after Benjamini Hotchberg correction27 with a P value <0.05 cutoff and a minimum of three gene transcripts represented from each category (Figure 4). Importantly, only EIAV insertions were found with statistical significance in the GO categories containing genes responsible for multiple genetic disorders and genes associated with cellular growth and proliferation, hepatic system development, and function, gene expression, and cancer. In line with the absence of tumor development in HR'SIN-cPPT-S-FIX-W HIV-treated mice, insertions by this vector were not found in these categories but restricted to genes that are associated with neuronal disorders (n = 104).
Figure 4.
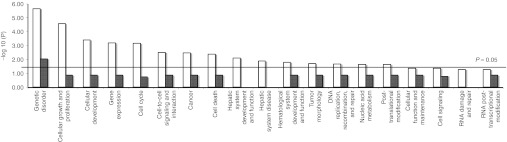
Analysis of the GO terms of RefSeq genes overrepresented in infected mouse livers by EIAV and HIV vectors. Ingenuity Pathways Knowledge Base software (IPA) was used to provide information on the enrichment of biological function and disease processes within given GO categories representing the inserted RefSeq genes. Fisher's exact test was used for P values of overrepresented genes in a given GO category compared with a random sample gene set (P value <0.05). Statistical significance is represented as –log10 P value and threshold of P = 0.05 is shown. P values <10−20 or lower were used to select highly significant biological networks and GO pathways after multiple comparison error correction using the Benjamini Hotchberg method27 and three or more genes per data set. Only the EIAV vector appeared in categories associated with cellular growth and proliferation, cancer, hepatic system development and function, and gene expression. EIAV, clear boxes and HIV, dark boxes. EIAV, equine infectious anemia virus.
Finally, we aligned our EIAV and HIV-insertion data sets with a human HCC microarray database of 65 liver disease samples of disease groups representing the stepwise oncogenic process from preneoplastic lesions of cirrhosis and dysplasia to HCC and also includes 10 healthy tissue samples.20 Matches were found common to cell adhesion, DNA replication, and apoptosis (Supplementary Table S3). Although none of the GO matches after Benjamini Hotchberg correction were found to be statistically significant (P value 0.05 cutoff) interestingly, only EIAV and not HIV insertions aligned with genes known to be involved in cellular proliferation that are also highly expressed during fetal development and associated with cancer. This included the Park7, Bre, and Ep300 genes that were identified as hotspots for insertion and of which two were found (Park7 and Bre) as clonal insertions in liver tumors.
Characterization of gene expression in representative vector-associated HCCs
We next performed microarrays on the clonal tumors of the three representative mice that were used for insertion site retrieval (1T2, 6T1, and 9T1) for a comparison of global differential gene expression between each tumor and their respective normal liver tissue. We included in this analysis, comparison with a spontaneous HCC of an untreated 568-day-old mouse that served as an uninfected HCC control. Using the top 500 differentially expressed genes between these tumors and normal livers (with a negative Log 2 ratio fold change cutoff of 1.5 or 1/1.5, P value <0.05 after Benjamini Hochberg correction), we initially created heat-maps to represent each differential gene expression profile (Supplementary Figure S5). These profiles appeared quite different between each tumor and the spontaneous HCC. The difference between gene expressions in these tumors was also evident when comparing overrepresented GO functions. In line with HCC, genes involved mainly in oxidative reduction in mouse 1T2, mouse 9T1, and the spontaneous HCC were most significantly represented. This was not seen in mouse 6T1 and this with other differences in enriched GOs between these tumors suggested the involvement of alternative biosynthetic pathways to oncogenesis (Supplementary Figure S5).
Genes in clonal tumors carrying vector insertions are differentially expressed
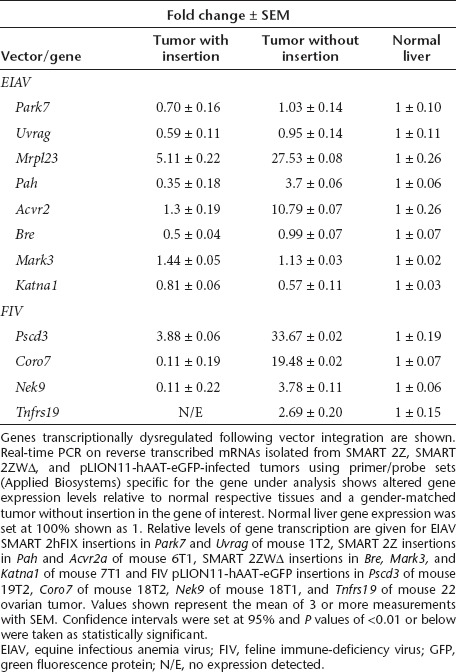
We examined the influence of vector insertion on gene expression using a representative selection of genes from the clonal tumors of EIAV and FIV vector-treated animals by real-time PCR of reverse transcribed purified mRNAs. Comparisons of gene expression levels were restricted to the gene with a provirus insertion in the tumor and the same gene in the respective normal liver tissue of the same animal to avoid variations in gene expression levels between mice of different ages and sexes. The control tumor used in this analysis without provirus insertion in the gene under investigation was also gender matched (Table 2). This selection encompassed known oncogenes or genes associated with cancer or specifically HCC (Pah, Park7, Acvr2a, Mark 3, Rabgef1, Tnfrs19, Pscd3) and a tumor suppressor gene (Uvrag). We found Park7, Uvrag, Pah, Bre, Katna1, Nek9, Coro7, and Tnfrs19 gene expression reduced relative to controls. The Acvr2a, Mrpl23, and Pscd3 genes were increased in expression relative to the normal liver but significantly lower in expression than their control-matched tumors suggesting that they are upregulated in HCC but lower possibly as a result of vector insertion. Mark3 gene expression was found only slightly elevated and we did not find altered gene expression of Rabgef1.
Table 2. Differential expression of genes and gene pathways in tumors.
Because our profiling of EIAV insertions in normal livers showed vector integrations mainly in highly expressed genes in the fetus, we compared the normal expression levels of the vector-inserted genes, at E16-day3 period, we found differential expression using real-time PCR in clonal tumors with representative genes known to be either expressed at high or at low levels naturally in the mouse at this developmental period. As compared with the pregnancy-specific glycoprotein 19 (Psg19) gene that is expressed at low levels during this period, the inserted genes are normally expressed at between 5 and 229-fold greater levels. As compared with the expression of the albumin (Alb) gene, however, which is very highly expressed during this period their normal expression was lower by between 5 and 206-fold. This analysis did not, therefore, discriminate EIAV preference for insertion only into very highly expressed genes.
Mouse 1T2 tumor inserted genes and their related partners are found in networks associated with liver disease
We next chose a representative tumor (mouse 1T2) to investigate how virus integration may be associated with oncogenesis. This mouse was chosen for the analysis because first we had characterized its tumor with elevated expression of genes associated with oxidative stress, which is a hallmark of HCC and second as insertions in the Park7 oncogene and Uvrag tumor suppressor gene were found in this tumor. Although there were additional insertions in the Mrpl23 and Rabgef1 genes, Rabgef1 was not found differentially expressed and there is no association between Mrpl23 and cancer. Third, we had identified Park7 in the human HCC database and Uvrag that is also associated with cancer. Finally, these genes were also identified as hotspots for insertion and were found reduced in expressed by real-time PCR.
Initially, we found interactive partners to Park 7 and Uvrag genes using the STRING (http://string-db.org/) database that provides information on predicted protein–protein interactions that includes direct (physical) and indirect (functional) associations to identify interactive genes (with significant associated combined scores 0.4 confidence level). We then collated gene expression levels from our microarray of this tumor according to a P value significance cutoff of <0.05 (after Benjamini Hochberg correction) rather than 1.5 negative log 2 fold cutoff to maximize our data set. We next identified differential expression of the interactive partners of Park 7 and Uvrag in our microarray database of this tumor (Supplementary Figure S6 and Supplementary Table S4).
Finally, we subjected these gene sets to IPA network analysis that directly links them to pathways involved in liver disease and cancer of the liver. The pathways identified included apoptosis of hepatocytes, repair of DNA, liver tumorigenesis, hepatocyte proliferation, cell cycle progression, transcription, and HCC (Figure 5).
Figure 5.
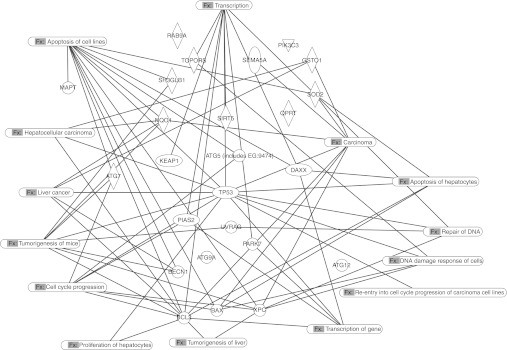
Biological networks and functional pathways linking Park7 and Uvrag genes. IPA network analysis of Park7 and Uvrag from (mouse 1T2) found with significant differential expression in the microarray from these mice compared with their respective controls and ranked by fold change (−log2 ratio, cutoff P value <0.05 after Benjamini Hochberg correction). Networks show interactive genes linked to pathways that include apoptosis in the liver, DNA repair, liver tumorigenesis, hepatocyte proliferation, cell cycle progression, transcription, and hepatocellular carcinoma (HCC). Their detailed involvement in HCC requires further investigation.
Discussion
The potential for RV and LV-mediated side effects following nontargeted, somatic gene transfer is still unknown. We suspect that a significant genotoxic risk could be present following in vivo gene transfer to several cell types with different spatial and temporal profiles of gene expression by vectors that are known to prefer to integrate into gene promoters and/or active gene transcription units. In contrast to ex-vivo gene therapy, the in vivo approach does not rely on cell engraftment for survival and proliferation and therefore, it is possible that a significant population of cells harboring provirus “hits ” into cancer-related genes could survive after gene transfer which theoretically increases the risk of insertional mutagenesis leading to oncogenesis. Genotoxicity models in vivo are, therefore, essential to reflect this risk following somatic gene therapy.
In an earlier study, we found oncogenesis associated with SMART 2 and 3 EIAV-based nonprimate (np) LV vectors but not with the HR'SIN-cPPT-S-FIX-W HIV-1-derived primate (p) LV 13. Because the X gene present on the WPRE in its full-length form is known to be involved in HCC, our initial goal was to determine if the tX is involved in oncogenesis. This suspicion was supported by differences in tX gene configurations between the HR'SIN-cPPT-S-FIX-W pLV vector with mutations to prevent tX expression and the SMART 2 npLV without these mutations. Because we found liver tumors in mice treated with the mutated form of SMART 2 and also with an alternative npLV FIV vector, pLION11-hAAT-eGFP carrying mutations identical to HR'SIN-cPPT-S-FIX-W ruled out tX gene involvement in oncogenesis. Furthermore, mice treated with the RRL.SIN-CMV-FIX vector without these mutations did not develop tumors following fetal gene transfer.
The fetal mouse has many highly expressed genes that control cellular proliferation and differentiation that are also known to be associated with HCC.14 The MF-1 mouse is not genetically predisposed to cancer and we have found that this outbred mouse strain allows life-long vector presence with transgene expression. On the basis of our findings that EIAV and FIV npLVs but not HIV LVs are associated with liver cancer, we propose this model to be a sensitive platform to test for vector-associated genotoxicity. In addition, as high transcriptional activity is known to have a potentially strong influence on LV integration,23,24 we suspected that the difference in oncogenic outread between these vectors may be due to differences in their insertion site preferences in the mouse genome. It is important to note that comparisons of insertions sites were made between EIAV and HIV LVs at the end point of our study and would therefore include any bias in the clonal outgrowth of cells caused by a genotoxic vector.
LV-insertion profiles that have been described in previous studies10,11,24 were also evident in the fetally treated mouse liver in this study. These included preference for the transcription unit, insertion away from the transcription start site, and CpG islands that represent gene promoter regions, and insertion into AT rich DNA. Of note, we found SMART 2 vector insertions appearing in gene dense regions to a much greater extent than HR'SIN-cPPT-S-FIX-W and clearly different patterns of insertions in particular chromosomes were evident between the LVs. This is in contrast to previous work using different immortal cell lines that revealed hotspots for HIV in different human chromosomes and no hotspots for EIAV integration.11,23 In the fetus, hotspots for SMART 2 insertion were found in several genes whereas none were found for HR'SIN-cPPT-S-FIX-W. These hotspots (using a 500 bp interval) included several unique SMART 2 integrations narrowly clustered on chromosome 5 in genes surrounding the albumin locus known to be highly expressed before birth in the mouse.14 This suggested, once again, that the EIAV vector has a preference for highly expressed genes or possibly that our identification of these hotspots may be influenced by cellular proliferation as a result of clonal outgrowth mediated by SMART 2 genotoxicity.
Our global insertion site profile of SMART 2 integrations in highly expressed genes was also confirmed by our horizontal GO comparative analysis that showed insertion sites occurring in highly expressed genes around the E16 period of development. The fact that SMART 2 integration may have influenced cellular outgrowth was further supported by our IPA analysis that identified the GOs of genes with insertions of this vector and not the HIV vector in categories associated with cellular proliferation, hepatic system development and function, gene expression, and liver cancer. Interestingly, the Uvrag tumor suppressor gene and the Park 7 oncogene, Cyp3a11, and Mrpl23 genes that were identified as hotspots for insertion at the 500 bp and 100 kb intervals, respectively, were also found in clonal tumors with SMART 2 integrations.
Our analysis of vector copy number following in utero gene transfer shows that it is difficult to control vector delivery to the liver during in utero gene transfer as VCN varied widely between LVs. A potential reason for the difference in HIV and EIAV VCNs found, even though similar vector doses of VSV-G envelope pseudotyped vectors were used (107 IU/fetus), may be associated with the required level of the epithelium-derived growth factor LEDGF/p75 required by each LV to tether the vector genome to its site of integration. High-level LEDGF/p75 expression is believed to influence integration into actively transcribed regions of DNA 22, and EIAV LV infection levels have been found significantly impaired by reduced levels of LEDGF/p75 as compared with HIV LV in murine cells depleted for LEDGF/p75 (50-fold versus fivefold, respectively). In the fetal mouse relative to the adult LEDGF/p75, expression is fivefold greater and if EIAV is more dependant on LEDGF/p75 than HIV, then high level LEDGF/p75 expression may account for high EIAV VCN. It would be interesting to determine the role of LEDGF/p75 expression also on FIV integration. Low HIV VCN may also be the reason for the absence of oncogenesis in the HIV-treated mice; however, in our previous study HIV VCN was similar to that found for EIAV, yet neither the HR'SIN-cPPT-S-FIX-W nor RRL.SIN-CMV-FIX HIV vectors were associated with oncogenesis. VCN may not necessarily be very accurate in measuring genotoxicity as in our previous work, we found that even at undetectable VCN levels measured by Q-PCR, one mouse still developed an HCC carrying a clonal SMART 2 insertion.13 Importantly, our measurement of high EIAV and FIV VCNs versus low HIV VCN may once again be influenced by npLV driven clonal outgrowth of cells and only measurement of VCN at an early time point followed by comparison with the data presented in this work would address this issue.
For our comparative real-time PCR analysis of gene expression levels, we measured the level of gene expression of genes in tumors carrying provirus insertions within the gene. This was compared to the level of expression of each gene in the respective normal liver of the mouse bearing a tumor and matched mouse tumors without insertions in the gene under investigation. Although we used gender and age-matched controls, we are aware that this allowed only limited statistical analysis of the data. To circumvent this difficulty to some degree, we performed real-time PCR on samples harvested from at least four different sites in each tumor and normal liver tissue. We also realize that although our microarray analysis used gender-matched mouse tumor controls, these were not of identical ages and it is likely that in each tumor, different pathways may be responsible for the development of liver cancer. Furthermore, even though high-density microarray analysis is believed capable to confirm altered levels of gene expression found by real-time PCR, this is not always possible for every gene set under investigation28 and we therefore, did not expect to be able to achieve accurate matches between every differentially expressed gene examined by the two techniques as was sometimes the case during our analysis.
Nonetheless, assuming our observations were mediated by vector genotoxicity, we linked the Park7 and Uvrag genes that carried viral insertions, showed reduced in expression by Q-PCR, with their interactive partners using the STRING database in a representative tumor, and identified these genes in our tumor microarray. Applying this data set to IPA analysis, we determined which gene networks could have been involved in oncogenesis. Although this identified genes belonging to pathways involved in liver disease, cancer, and specifically HCC, that may have differential expression influenced by vector integration, we cannot rule out that these genes may be altered in expression as a result of effects not related to vector integration. Hence, we are still only able to speculate that insertion by SMART 2 in the Park7 oncogene and Uvrag tumor suppressor gene in the same tumor may have initiated neoplasia.
A possible mechanism behind mutagenesis in the treated mice by SMART 2 and pLION11-hAAT-eGFP vector is the configuration of splice donor and acceptor sites in these vectors. Aberrant splicing is known to cause altered oncogene expression as was shown in the tumor prone model.9 Interestingly, both SMART 2Z and pLION11-hAAT-eGFP have splice donor and acceptor sites some distance apart either side of the transgene and promoter as opposed to HR'SIN-cPPT-S-FIX-W where both splice sites are 5′ to the transgene and promoter. The importance of the splice acceptor in SMART 2 and pLION11-hAAT-eGFP just 5′ of WPRE is yet to be investigated. In theory, splicing of cellular genes with the vector, if in the appropriate orientation, could result in WPRE being introduced onto cellular RNA which could result in prolonged RNA half live and increased gene expression. Alternatively, splicing could also result in nonfunctional truncated proteins thereby effectively reducing gene expression.
In summary and following on from our previous report, we conclude in this study that the X gene is not directly involved in oncogenesis after in utero gene transfer. We find genes mostly downregulated following SMART 2 and pLION11-hAAT-eGFP insertion and that the EIAV vector either has a preference for highly expressed genes and gene dense regions or may have caused clonal outgrowth of cells following integration. We aim to determine this by comparing our current insertion site profiles with those of mice killed at a 2-week time point following SMART 2 administration before clonal outgrowth could occur.
We believe, therefore, this highly transcriptionally active and proliferative model with an unperturbed genetic background to be a particularly sensitive alternative animal system to test for genotoxicity following in vivo gene transfer as demonstrated here by significant differences in the genotoxic potential between the LVs tested. We propose this model as highly useful to screen novel therapeutic integrative vectors intended for safe clinical gene therapy. Due to its sensitivity, this model may even be extended to nonintegrating vectors that are currently considered safe because they only rarely integrate in the genome in a more randomly manner.29 Although we have not observed oncogenesis associated with the HIV-derived vectors used in this study, we cannot rule out that these vectors may be genotoxic in an alternative model and hence we cannot assume them to be completely safe. As for any genotoxicity model, conclusions about vector safety drawn from this fetal mouse model should be made with caution as it may not be capable of accurately representing the likelihood of insertional mutagenesis in humans following LV-mediated gene transfer. However, as HCC is such a common disease being the fifth most common cancer in humans, we also propose that the fetal model may also be considered as a useful tool to research the cause of this disease.
Materials and Methods
Animal procedures and tissue harvests. MF1 mice were used for in utero injection. All animal work was carried out in accordance with UK Home Office regulation and was compliant with the guidelines of the Imperial College London ethical review committee. Details of the animal procedures and harvests used have been previously described.13 Sampling was performed by dissection of four parts of each tissue to be investigated.
Vector production and titration. EIAV SMART 2 lentivectors were produced using transient transfection of human embryonic kidney 293T cells and titered as previously described.30,31 X-gal staining was performed using standard procedures.17 No replication competent virus was identified using the method described by Martin-Rendon et al.32 EIAV vector preparations were generated and titered by Oxford BioMedica plc (Oxford, UK).
Recombinant HR'SIN-cPPT-S-FIX-W HIV vectors were also produced by transient transfections of 293T cells and titered using a commercial immunoassay kit for p24 gag (Beckman Coulter, High Wycombe, UK) as previously described18 that routinely provided concentrations with a range 20–40 ng/µl of p24 protein. Generation of the HR'SIN-cPPT-S-FIX-W vector carrying the human factor IX (hFIX) cDNA after replacement of GFP from pHR'SIN-cPPT-SEW has also been described.18 Virus titers were calculated using batches of HR'SIN-cPPT-S-FIX-W hFIX- and pHR'SIN-cPPT-SEW eGFP-lentivirus prepared in parallel. Fluorescence-activated cell sorting analysis of cells after infection by eGFP-lentivirus yielded a titer of 5 × 10⁸ infectious particles/ml.
pLION11-hAAT-eGFP FIV particles were generated as previously described using the 293T packaging cell line.33 HR'SIN-cPPT-S-FIX-W and pLION11-hAAT-eGFP vector particles were concentrated 100-fold by ultracentrifugation at 50,000 g for 90 minutes at 4 °C. The pellet was resuspended in serum-free X-VIVO10 (BioWhittaker Europe, Verviers, Belgium) and stored at −80 °C.
Fluorescence-activated cell sorting analysis of cells after infection by pLION11-hAAT-eGFP yielded a titer of 1 × 10⁹ infectious particles (TU)/ml. All viruses used were pseudotyped using the VSV-G envelope.
Measurement of hFIX antigen (hFIX:Ag) expression. Plasma samples containing hFIX:Ag after collection of 100 µl of mouse blood in Na Citrate and centrifugation was measured using a specific hFIX:Ag enzyme-linked immunosorbent assay as directed by the manufacturer (Roche Diagnostics, Mannheim, Germany). Human FIX reference supplied with the kit was used to create standard curve measurements of diluted hFIX:Ag for direct comparability. Mouse plasma samples were assayed at 50-fold dilution.
Immunohistochemistry. Liver tissue fixed in 25% formalin overnight, transferred to 70% ethanol, and processed into paraffin was used to detect GFP expression. GFP was detected after microwaving in citrate buffer then incubation with rabbit anti-eGFP (A-6455, Molecular Probes, Eugene, Oregon) as previously described.18
Quantitative of VCN by real-time PCR. Lentiviral copy number in DNA samples was also determined using primer/probe sets designed to recognize the human FIX cDNA (for HR'SIN-cPPT-S-FIX-W) or the EIAV and FIV packaging signals in SMART 2 and pLION11-hAAT-eGFP, respectively. Quantitative PCR was performed using an ABI PrismR7900HT sequence detector (Applied Biosystems, Warrington, UK) as previously described.13 Absolute quantification was used to mathematically determine the viral load by comparing a range of standards concentrations. The range of standards was derived from a reliable tumor sample with a known copy number via Southern blot analysis. The genomic DNA was diluted twofold from a starting concentration of 500 ng to provide a range of 500–15.625 ng. Cycle threshold (CT) values were obtained using probes specific to the glyceraldehyde 3-phosphate dehydrogenase housekeeping gene, the WPRE virus vector sequences common to HR'SIN-cPPT-S-FIX-W and pLION11-hAAT-eGFP and the packaging signal (ψ) of the SMART 2 vector. Raw CT values from tumors and normal livers were normalized against those of the standard curve.
The amplification was carried out in a final volume of 20 µl in which each reaction contained 18 µl of TaqMan Universal PCR Master Mix (Amperase UNG, AmpliTaq Gold polymerase, dNTP, Applied Biosystems), 100 mmol/l of each primer and probe, and 31.25 ng of genomic DNA. All samples were tested in triplicate and the variation between the CT of each duplicate was ≤0.5 Ct. The total number of genomes was recorded for each concentration in the dilution series. A standard curve was constructed with Log10 genome values plotted against CT values for each concentration and a linear regression equation plotted. For unknown samples, VCNs were interpolated from the standard curve. For each unknown sample, the number of vector copies per genome (diploid) was calculated using the average CT values (per concentration) and linear regression values (slope and intercept) from the standard curve.
Real-time PCR to determine the effects of LV provirus insertion on inserted genes. RNAs were extracted using TRI reagent (Sigma Aldrich, Gillingham, UK) on tissue samples followed by chloroform extraction and isopropanol precipitation. RNAs were purified before cDNA synthesis using an Agilent Technology Company kit (Agilent technologies, Stratagene, Stockport, UK) as per the manufacturers instructions. Purified RNA was prepared using a High Capacity cDNA reverse transcription kit (Applied Biosystems). A reverse transcriptase master mix was prepared with RT buffer, dNTP mix, RT random primers, MultiScribe Reverse transcriptase, RNase inhibitor, and nuclease-free distilled water according to manufacturer's instructions (Applied Biosystems) was used for cDNA synthesis using 125 ng of total RNA. cDNA of 2 µl was used with PCR Mastermix and TaqMan Assays (Amperase UNG, AmpliTaq Gold polymerase, dNTP, Applied Biosystems). All reactions were carried out in triplicate on an ABI Prism7900HT real-time PCR instrument (Applied Biosystems) using primer/probe sets designed for each gene under examination obtained from Applied Biosystems. Absolute Quantification (standard curve) reactions were used to optimize the TaqMan reactions using serially diluted cDNA samples (500–15.625 ng/µl). Relative quantification was performed on quadruplicate PCR reactions using the ΔΔCt method.34 Data were analyzed with SDS software and cycle thresholds obtained were normalized ribosomal 18S expression (control) and calibrated to normal tissue and a gender-matched tumor control for relative quantification.
Locus-specific PCR was performed on two genes from two tumors which were identified by LAM PCR/454 and Sanger and Coulson sequencing methods. Primer/probe sets for Pah and Uvrag genes and the 5′ LTR of the SMART 2 vector were as follows: 1. Uvrag, Forward 5′-G TACCTTGCAGGC TTTAATTGTCC-3′, Reverse 5′-AAGGTTATGAGAGCATCAGCAAC-3′. Product 293 bp. Probe FAM 5′-CGCCTGGCTCCAGCGGCACC-3′ Tamra. Pah, Forward 5′-CCTAGATAGAATCTTTCAGTTTGG-3′, Reverse 5′- CC TTTGGGTTATACAAGGTT ATG-3′. Product 266 bp. Probe 5′-CCTCA GTGCCACAAATTCAGGCTGC-3′. 5′ FAM, 3′ Tamra. EIAV-5′ LTR primer 5′-GTTATACAAGGTTATGAGAGC-3′. PCR products were tested to identify correct product sizes before Q-PCR. Genomic DNAs were subjected to amplifications as described above. CT values using primer/probes specific to the glyceraldehyde 3-phosphate dehydrogenase housekeeping gene were used to calculate the presence of a gene in 100% of the genomes of cells in each tumor. The CTs of each gene under investigation was compared with that of glyceraldehyde 3-phosphate dehydrogenase to obtain the percentage of the locus-specific virus/gene representing clonally derived cells. All samples were tested in quadruplicate and ΔCT SDs were used to represent SEMs. DNA from normal livers from each mouse and an uninfected mouse were used as negative controls to show no amplifications.
Amplification of vector-genomic DNA junctions. Genomic DNA was extracted from tumors as previously described.13 LAM-PCR: linear amplification for the SMART 2 EIAV vector was performed as previously described.35,36
LAM-PCR of genomic DNA adjacent to the pLION11-hAAT-eGFP vector was also performed using 100 ng of genomic DNA and 2.5 U Taq polymerase using the following two biotinylated primers of sequences found in the 5′ LTR: 5′-GTT CTC GGC CCG GAT TCC-3′ and 5′-CCC GGA TTC CGA GAC CTC-3′ (50 µl final volume). Cycle parameters of 95 °C for 5 minutes (single cycle) followed by 95 °C for 60 seconds, 60 °C for 45 seconds, 72 °C 90 seconds for 50 cycles, 72 °C for 10 minutes. 2.5 U additional Taq polymerase was added and the PCR run for another 50 cycles. PCR products were captured using the Dynabeads kilobase binder kit (Dynal, Oslo, Norway) and the second DNA strand was synthesized using Klenow (Invitrogen, Carlsbad, CA) with random hexanucleotides (Invitrogen, Paisley, UK) (20 µl reaction mixture) at 37 °C for 1 hour. The double stranded DNA was digested with Tsp509I and a linker oligonucleotide added (5′-GAC CCG GGA GAT CTG AAT TCA GTG GCA CAG CAG TTA GG-3′ and 5′-AAT TCC TAA CTG CTG TGC CAC TGA ATT CAG ATC-3′) followed by ligation with Fast Link DNA Ligase kit (Epicentre Technologies, Madison, Wisconsin) for 15 minutes at room temperature. The DNA was denatured with 0.1 mol/l NaOH before two rounds of PCR using the same conditions as the linear amplification with primers: FIV LTR 5′-CTC GAC AGG GTT CAA TCT C-3′ and linker 5′- GAC CCG GGA GAT CTG AAT TC-3′ followed by nested PCR primers: FIV LTR 5′-CTC AAA AGT CCT CAA CAA AG-3′ and linker 5′ GAT CTG AAT TCA GTG GCA CAG-3′. PCR products were separated on 3% agarose gels and DNA fragments were isolated using a Quiex II gel extraction kit (Qiagen, Crawley, UK) and cloned into a TOPO TA plasmid cloning kit (Invitrogen) as per the manufacturer's instructions. Bacterial colonies containing DNA fragments corresponding to those seen in the second round PCR were sequenced using the FIV-specific nested primer (Leicester University, Leicester, UK). EIAV and HIV-insertion sites cloned by LAM PCR and nonrestrictive PCR techniques obtained using 100–300 ng of sample genomic DNA were sequenced by deep parallel pyrosequencing (GS FLX/454: Roche, Mannheim, Germany) then subjected to Blas2Seq and the Smith-Waterman algorithm as previously described.37
Sequences were aligned with the mouse genome (Mus musculus genome) assembly July 2007 (NCBI37/mm9, UCSC M. musculus genome version 8) using UCSC BLAT genome browser (http://genome.ucsc.edu) or BLAST (http://www.ncbi.nlm.nih.gov/genome/seq/MmBlast.html). The molecular function and role in biological processes of each integration near to or within a RefSeq gene (within a 100 kb window) was determined using the Gene Ontology database and identified with potential to be a candidate gene involved in tumorigenesis. Candidate genes were searched against the Mouse Retroviral Tagged Cancer Gene Database (RTCGD; http://RTCGD.ncifcrf.gov).
Determination of lentivirus copy number by Southern analysis. Southern analysis of genomic tumor DNA was carried out as previously described.13 Briefly, 10 µg of genomic DNAs were digested with Hind III that allows the EIAV provirus and adjacent mouse 3′ genomic DNA to be identified after separation in 0.6% agarose gels and hybridization with a 625 bp WPRE probe excised from the pSMART 2Z plasmid. The FIV vector was probed with a 700 bp GFP probe. Probes were routinely produced using a random primed labeling kit (Mega-prime system Amersham, UK) with a-32P-CTP. Autoradiographs were used to visualize provirus bands on Hybond N+ nylon membranes (Amersham).
Microarrays. Total RNA was isolated from liver tissues using Trizol reagent (Invitrogen) then subjected to gene expression profiling using an Illumina mouse sentrix-8 microarray chip from Illumina recognizing 25,000 sequences to provide a measurement of genes whose expression had been up or downregulated with high sensitivity. The gene expression values were extracted using the GenomeStudio software and filtered according to fluorescence above chip background. Data were quantile normalized and analyzed using the bioconductor http://www.bioconductor.org/, http://www.bioconductor.org/packages/2.0/bioc/html/lumi.html lumi and limma packages. Data were P value adjusted to yield a sorted list of differentially expression genes.
GO function analysis of microarrays. The Gene Ontology file (version: 1.513; Date: 09/29/2009) and the mouse annotation file (gene_association.mgi. version: 1.806; Date: 01/15/2010) were downloaded from http://www.geneontology.org. We selected the top 500 significantly differentially expressed genes and ranked these by fold change (log2 ratio, P value <0.05). Hypergeometric distributions were used to detect overrepresented or underrepresented biological process terms in the study set compared with the population set. Here, the population set was constructed using all genes in the microarray of mouse 1T2 13, mouse 6T1, and mouse 9T1 tumors and a spontaneous HCC that occurred in a 568-days-old mouse. Probabilities obtained by hypergeometric distributions were subject to Benjamini Hotchburg correction.27
Randomized data set generation. To assess whether insertion sites where assigned to chromosomes randomly, randomization was carried out 100-times to yield 100 randomized counts of vector inserts per chromosomes. A t-test (95% confidence) was performed between the single observed count of sites per chromosome and the randomized population of 100 counts. Similarly, for CG content and gene density statistics, randomized data were generated across the genome. To determine the nature of vector insertion distances from transcription start site and regions within genes, t-tests were performed between observed data and those data generated from sites assigned to random locations, 100-times, within the gene.
Analysis of biological networks by Ingenuity Pathway Analysis (IPA). Network analysis was performed on lists of genes generated from the earlier analyses described above as being differentially expressed. IPA (Ingenuity Systems, Redwood City, CA) that contains data of individually curated relationships between gene objects (e.g., genes, mRNAs, and proteins) was used for the identification of the biological processes that are significantly overrepresented to generate significant biological networks and pathways. Statistical significance of the biological overrepresentation was determined using Fisher's exact P value based on the relative overrepresentation of a minimum of three genes in the particular pathway as compared with a random sample of genes (P value cutoff of <0.05). Scores corresponding to P < 10−20 or lower after Benjamini Hotchburg correction were used to select highly significant biological networks.
SUPPLEMENTARY MATERIAL Figure S1. Survival of cohorts treated with lentivirus vectors. Figure S2. Representative Southern analysis of tumors and respective normal livers. Figure S3. Insertion site profiles of EIAV and HIV vectors in total tissues after killing. Figure S4. Linear representation of the regional hotspot for EIAV SMART 2 vector insertion in chromosome 5. Figure S5. Global analysis of tumor gene expression. Figure S6. Gene pathways associated with provirus-integrated genes Park 7 and Uvrag. Table S1. Vector integration sites in tumors. Table S2. Hotspots for EIAV integration using 500 bp and 100 kb intervals. Table S3. Alignment of RefSeq insertions with human HCC samples. Table S4. Microarray of differentially expressed genes belonging to pathways associated with genes with altered expression identified by real-time PCR.
Acknowledgments
We are grateful to Eithan Galun, Goldyne Savad Institute of Gene Therapy,Hadassah Hebrew University Hospital, Jerusalem, 91120, Israel for providing pLION11-hAAT-eGFP virus containing supernatant. This work was funded by Imperial College London, a Wellcome Trust Value in People award and a Brunel University BRIEF award.
Supplementary Material
Survival of cohorts treated with lentivirus vectors.
Representative Southern analysis of tumors and respective normal livers.
Insertion site profiles of EIAV and HIV vectors in total tissues after killing.
Linear representation of the regional hotspot for EIAV SMART 2 vector insertion in chromosome 5.
Global analysis of tumor gene expression.
Gene pathways associated with provirus-integrated genes Park 7 and Uvrag.
Vector integration sites in tumors.
Hotspots for EIAV integration using 500 bp and 100 kb intervals.
Alignment of RefSeq insertions with human HCC samples.
Microarray of differentially expressed genes belonging to pathways associated with genes with altered expression identified by real-time PCR.
REFERENCES
- Hacein-Bey-Abina S, Von Kalle C, Schmidt M, McCormack MP, Wulffraat N, Leboulch P.et al. (2003LMO2-associated clonal T cell proliferation in two patients after gene therapy for SCID-X1 Science 302415–419. [DOI] [PubMed] [Google Scholar]
- Howe SJ, Mansour MR, Schwarzwaelder K, Bartholomae C, Hubank M, Kempski H.et al. (2008Insertional mutagenesis combined with acquired somatic mutations causes leukemogenesis following gene therapy of SCID-X1 patients J Clin Invest 1183143–3150. [DOI] [PMC free article] [PubMed] [Google Scholar]
- Ott MG, Schmidt M, Schwarzwaelder K, Stein S, Siler U, Koehl U.et al. (2006Correction of X-linked chronic granulomatous disease by gene therapy, augmented by insertional activation of MDS1-EVI1, PRDM16 or SETBP1 Nat Med 12401–409. [DOI] [PubMed] [Google Scholar]
- Montini E, Cesana D, Schmidt M, Sanvito F, Ponzoni M, Bartholomae C.et al. (2006Hematopoietic stem cell gene transfer in a tumor-prone mouse model uncovers low genotoxicity of lentiviral vector integration Nat Biotechnol 24687–696. [DOI] [PubMed] [Google Scholar]
- Modlich U, Bohne J, Schmidt M, von Kalle C, Knöss S, Schambach A.et al. (2006Cell-culture assays reveal the importance of retroviral vector design for insertional genotoxicity Blood 1082545–2553. [DOI] [PMC free article] [PubMed] [Google Scholar]
- Nienhuis AW, Dunbar CE., and, Sorrentino BP. Genotoxicity of retroviral integration in hematopoietic cells. Mol Ther. 2006;13:1031–1049. doi: 10.1016/j.ymthe.2006.03.001. [DOI] [PubMed] [Google Scholar]
- Baum C, Düllmann J, Li Z, Fehse B, Meyer J, Williams DA.et al. (2003Side effects of retroviral gene transfer into hematopoietic stem cells Blood 1012099–2114. [DOI] [PubMed] [Google Scholar]
- Modlich U, Kustikova OS, Schmidt M, Rudolph C, Meyer J, Li Z.et al. (2005Leukemias following retroviral transfer of multidrug resistance 1 (MDR1) are driven by combinatorial insertional mutagenesis Blood 1054235–4246. [DOI] [PubMed] [Google Scholar]
- Montini E, Cesana D, Schmidt M, Sanvito F, Bartholomae CC, Ranzani M.et al. (2009The genotoxic potential of retroviral vectors is strongly modulated by vector design and integration site selection in a mouse model of HSC gene therapy J Clin Invest 119964–975. [DOI] [PMC free article] [PubMed] [Google Scholar]
- Wu X, Li Y, Crise B., and, Burgess SM. Transcription start regions in the human genome are favored targets for MLV integration. Science. 2003;300:1749–1751. doi: 10.1126/science.1083413. [DOI] [PubMed] [Google Scholar]
- Hacker CV, Vink CA, Wardell TW, Lee S, Treasure P, Kingsman SM.et al. (2006The integration profile of EIAV-based vectors Mol Ther 14536–545. [DOI] [PubMed] [Google Scholar]
- Cavazzana-Calvo M, Payen E, Negre O, Wang G, Hehir K, Fusil F.et al. (2010Transfusion independence and HMGA2 activation after gene therapy of human ß-thalassaemia Nature 467318–322. [DOI] [PMC free article] [PubMed] [Google Scholar]
- Themis M, Waddington SN, Schmidt M, von Kalle C, Wang Y, Al-Allaf F.et al. (2005Oncogenesis following delivery of a nonprimate lentiviral gene therapy vector to fetal and neonatal mice Mol Ther 12763–771. [DOI] [PubMed] [Google Scholar]
- Li T, Huang J, Jiang Y, Zeng Y, He F, Zhang MQ.et al. (2009Multi-stage analysis of gene expression and transcription regulation in C57/B6 mouse liver development Genomics 93235–242. [DOI] [PMC free article] [PubMed] [Google Scholar]
- Kingsman SM, Mitrophanous K., and, Olsen JC. Potential oncogene activity of the woodchuck hepatitis post-transcriptional regulatory element (WPRE) Gene Ther. 2005;12:3–4. doi: 10.1038/sj.gt.3302417. [DOI] [PubMed] [Google Scholar]
- Zanta-Boussif MA, Charrier S, Brice-Ouzet A, Martin S, Opolon P, Thrasher AJ.et al. (2009Validation of a mutated PRE sequence allowing high and sustained transgene expression while abrogating WHV-X protein synthesis: application to the gene therapy of WAS Gene Ther 16605–619. [DOI] [PubMed] [Google Scholar]
- Waddington SN, Mitrophanous KA, Ellard FM, Buckley SM, Nivsarkar M, Lawrence L.et al. (2003Long-term transgene expression by administration of a lentivirus-based vector to the fetal circulation of immuno-competent mice Gene Ther 101234–1240. [DOI] [PubMed] [Google Scholar]
- Waddington SN, Nivsarkar MS, Mistry AR, Buckley SM, Kemball-Cook G, Mosley KL.et al. (2004Permanent phenotypic correction of hemophilia B in immunocompetent mice by prenatal gene therapy Blood 1042714–2721. [DOI] [PubMed] [Google Scholar]
- Wu F, Liang YQ., and, Huang ZM. (The expression of DJ-1 gene in human hepatocellular carcinoma and its relationship with tumor invasion and metastasis) Zhonghua Gan Zang Bing Za Zhi. 2009;17:203–206. [PubMed] [Google Scholar]
- Wurmbach E, Chen YB, Khitrov G, Zhang W, Roayaie S, Schwartz M.et al. (2007Genome-wide molecular profiles of HCV-induced dysplasia and hepatocellular carcinoma Hepatology 45938–947. [DOI] [PubMed] [Google Scholar]
- Liang C, Feng P, Ku B, Oh BH., and, Jung JU. UVRAG: a new player in autophagy and tumor cell growth. Autophagy. 2007;3:69–71. doi: 10.4161/auto.3437. [DOI] [PubMed] [Google Scholar]
- Marshall HM, Ronen K, Berry C, Llano M, Sutherland H, Saenz D.et al. (2007Role of PSIP1/LEDGF/p75 in lentiviral infectivity and integration targeting PLoS ONE 2e1340. [DOI] [PMC free article] [PubMed] [Google Scholar]
- Schröder AR, Shinn P, Chen H, Berry C, Ecker JR., and, Bushman F. HIV-1 integration in the human genome favors active genes and local hotspots. Cell. 2002;110:521–529. doi: 10.1016/s0092-8674(02)00864-4. [DOI] [PubMed] [Google Scholar]
- Mitchell RS, Beitzel BF, Schroder AR, Shinn P, Chen H, Berry CC.et al. (2004Retroviral DNA integration: ASLV, HIV, and MLV show distinct target site preferences PLoS Biol 2E234. [DOI] [PMC free article] [PubMed] [Google Scholar]
- Dhami P, Saffrey P, Bruce AW, Dillon SC, Chiang K, Bonhoure N.et al. (2010Complex exon-intron marking by histone modifications is not determined solely by nucleosome distribution PLoS ONE 5e12339. [DOI] [PMC free article] [PubMed] [Google Scholar]
- Ciuffi A, Llano M, Poeschla E, Hoffmann C, Leipzig J, Shinn P.et al. (2005A role for LEDGF/p75 in targeting HIV DNA integration Nat Med 111287–1289. [DOI] [PubMed] [Google Scholar]
- Benjamini YaH Y. Controlling the false discovery rate:a practical and powerful approach to mulitiple testing. J Roy Statist Soc Ser. 1995;B57:289–300. [Google Scholar]
- Dallas PB, Gottardo NG, Firth MJ, Beesley AH, Hoffmann K, Terry PA.et al. (2005Gene expression levels assessed by oligonucleotide microarray analysis and quantitative real-time RT-PCR – how well do they correlate BMC Genomics 659. [DOI] [PMC free article] [PubMed] [Google Scholar]
- Mátrai J, Cantore A, Bartholomae CC, Annoni A, Wang W, Acosta-Sanchez A.et al. (2011Hepatocyte-targeted expression by integrase-defective lentiviral vectors induces antigen-specific tolerance in mice with low genotoxic risk Hepatology 531696–1707. [DOI] [PMC free article] [PubMed] [Google Scholar]
- Mitrophanous K, Yoon S, Rohll J, Patil D, Wilkes F, Kim V.et al. (1999Stable gene transfer to the nervous system using a non-primate lentiviral vector Gene Ther 61808–1818. [DOI] [PubMed] [Google Scholar]
- Olsen JC. Gene transfer vectors derived from equine infectious anemia virus. Gene Ther. 1998;5:1481–1487. doi: 10.1038/sj.gt.3300768. [DOI] [PubMed] [Google Scholar]
- Martin-Rendon E, White LJ, Olsen A, Mitrophanous KA., and, Mazarakis ND. New methods to titrate EIAV-based lentiviral vectors. Mol Ther. 2002;5 5 Pt 1:566–570. doi: 10.1006/mthe.2002.0576. [DOI] [PubMed] [Google Scholar]
- Condiotti R, Curran MA, Nolan GP, Giladi H, Ketzinel-Gilad M, Gross E.et al. (2004Prolonged liver-specific transgene expression by a non-primate lentiviral vector Biochem Biophys Res Commun 320998–1006. [DOI] [PubMed] [Google Scholar]
- Pfaffl MW. A new mathematical model for relative quantification in real-time RT-PCR. Nucleic Acids Res. 2001;29:e45. doi: 10.1093/nar/29.9.e45. [DOI] [PMC free article] [PubMed] [Google Scholar]
- Schmidt M, Zickler P, Hoffmann G, Haas S, Wissler M, Muessig A.et al. (2002Polyclonal long-term repopulating stem cell clones in a primate model Blood 1002737–2743. [DOI] [PubMed] [Google Scholar]
- Schmidt M, Carbonaro DA, Speckmann C, Wissler M, Bohnsack J, Elder M.et al. (2003Clonality analysis after retroviral-mediated gene transfer to CD34+ cells from the cord blood of ADA-deficient SCID neonates Nat Med 9463–468. [DOI] [PubMed] [Google Scholar]
- Kane NM, Nowrouzi A, Mukherjee S, Blundell MP, Greig JA, Lee WK.et al. (2010Lentivirus-mediated reprogramming of somatic cells in the absence of transgenic transcription factors Mol Ther 182139–2145. [DOI] [PMC free article] [PubMed] [Google Scholar]
Associated Data
This section collects any data citations, data availability statements, or supplementary materials included in this article.
Supplementary Materials
Survival of cohorts treated with lentivirus vectors.
Representative Southern analysis of tumors and respective normal livers.
Insertion site profiles of EIAV and HIV vectors in total tissues after killing.
Linear representation of the regional hotspot for EIAV SMART 2 vector insertion in chromosome 5.
Global analysis of tumor gene expression.
Gene pathways associated with provirus-integrated genes Park 7 and Uvrag.
Vector integration sites in tumors.
Hotspots for EIAV integration using 500 bp and 100 kb intervals.
Alignment of RefSeq insertions with human HCC samples.
Microarray of differentially expressed genes belonging to pathways associated with genes with altered expression identified by real-time PCR.