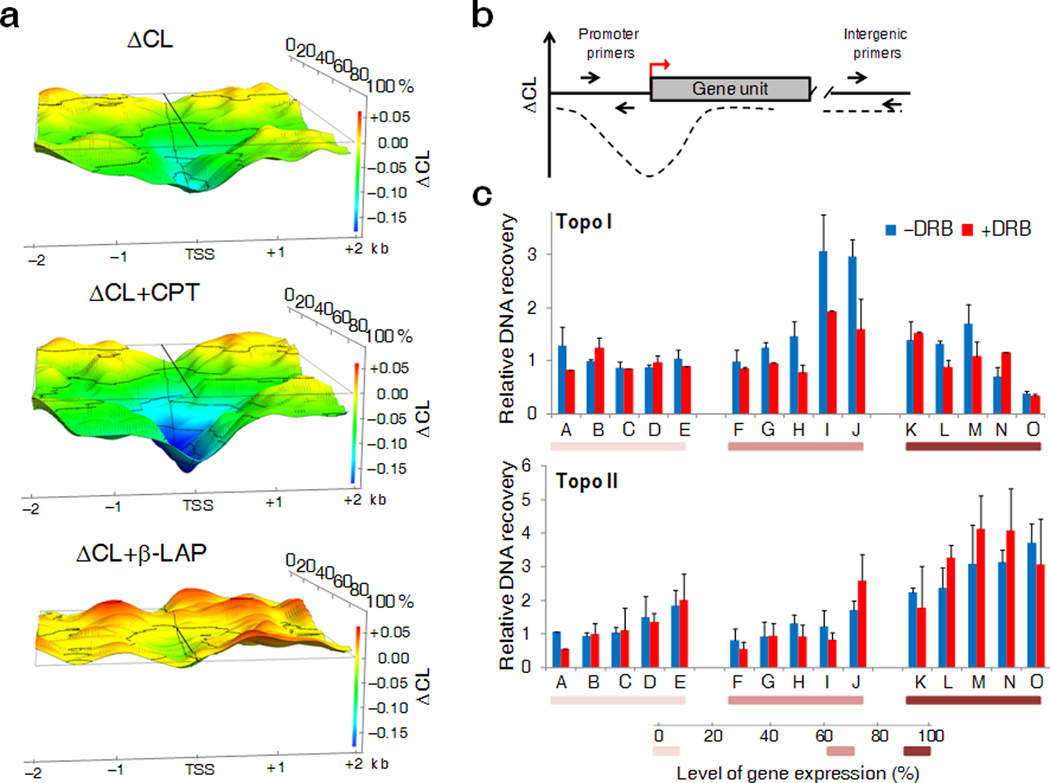
Figure 4. Perturbing the distribution of supercoils with topoisomerase inhibitors reveals the pattern of Topo I and Topo II recruitment to TSSs.
(a) 3-D representation of the ΔCL profiles of genes ranked according to their level of expression in the absence of topoisomerase inhibitors (top panel), in presence of CPT (central panel) or β-LAP (bottom panel). (b) Schematic representation of qPCR design for the ChIP analysis. DNA recovery was determined at promoters and at reference intergenic region. (c) Raji cells were treated with CPT or β-LAP in presence or absence of DRB and Topo I (top panel) or Topo II (bottom panel) occupancy was detected by ChIP. The relative enrichment of the topoisomerases at the promoter area of genes (indicated by alphabetical letter, see Online Methods for details) with different expression levels is shown. Five genes were analyzed in each expression range. Data are normalized to a non-expressed intergenic region (n=3–4, error bars, s.d.).

